As the crypto market shook off its week-long rally, the Sandbox [SAND] defied the trend as it surged 14.14%, hitting its thirty-day high. The metaverse token had followed the market sentiment earlier, registering greens for most of the recently-ended week.
However, the latest 24-hour rally was way better than whatever surge SAND recorded in the last seven-days. With The Sandbox obviously not slowing down its momentum, investors expectations in the short-term might align with the token’s persistence.
Here is AMBCrypto’s Price Prediction for The Sandbox [SAND] 2023-2024
Spread the message in every nook and cranny
A number of factors might have played a role in SAND’s rise to $0.908. However, an undeniable part would be The Sandbox having a notable fashion giant key into its metaverse plans.
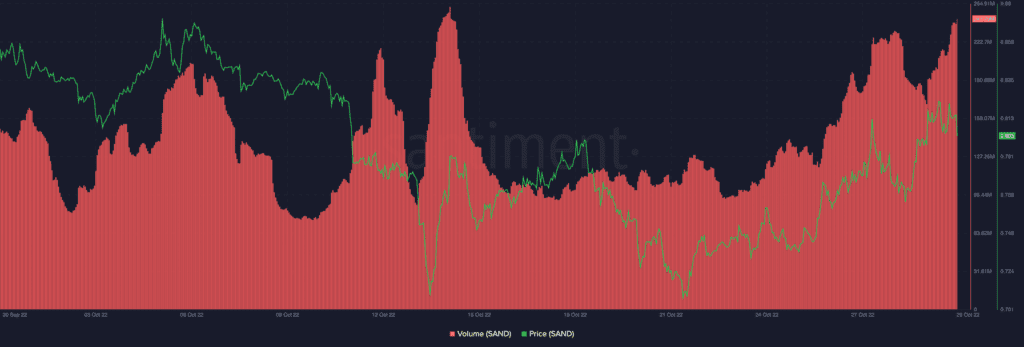
According to Forbes, fashion-power house, Gucci, officially went live with its first Sandbox experience. Interestingly, the web 3.0 event which started on 27 October would run until 9 November. The implication of this might be that SAND could remain relevant even as its 24-hour trading volume surged over 170%.
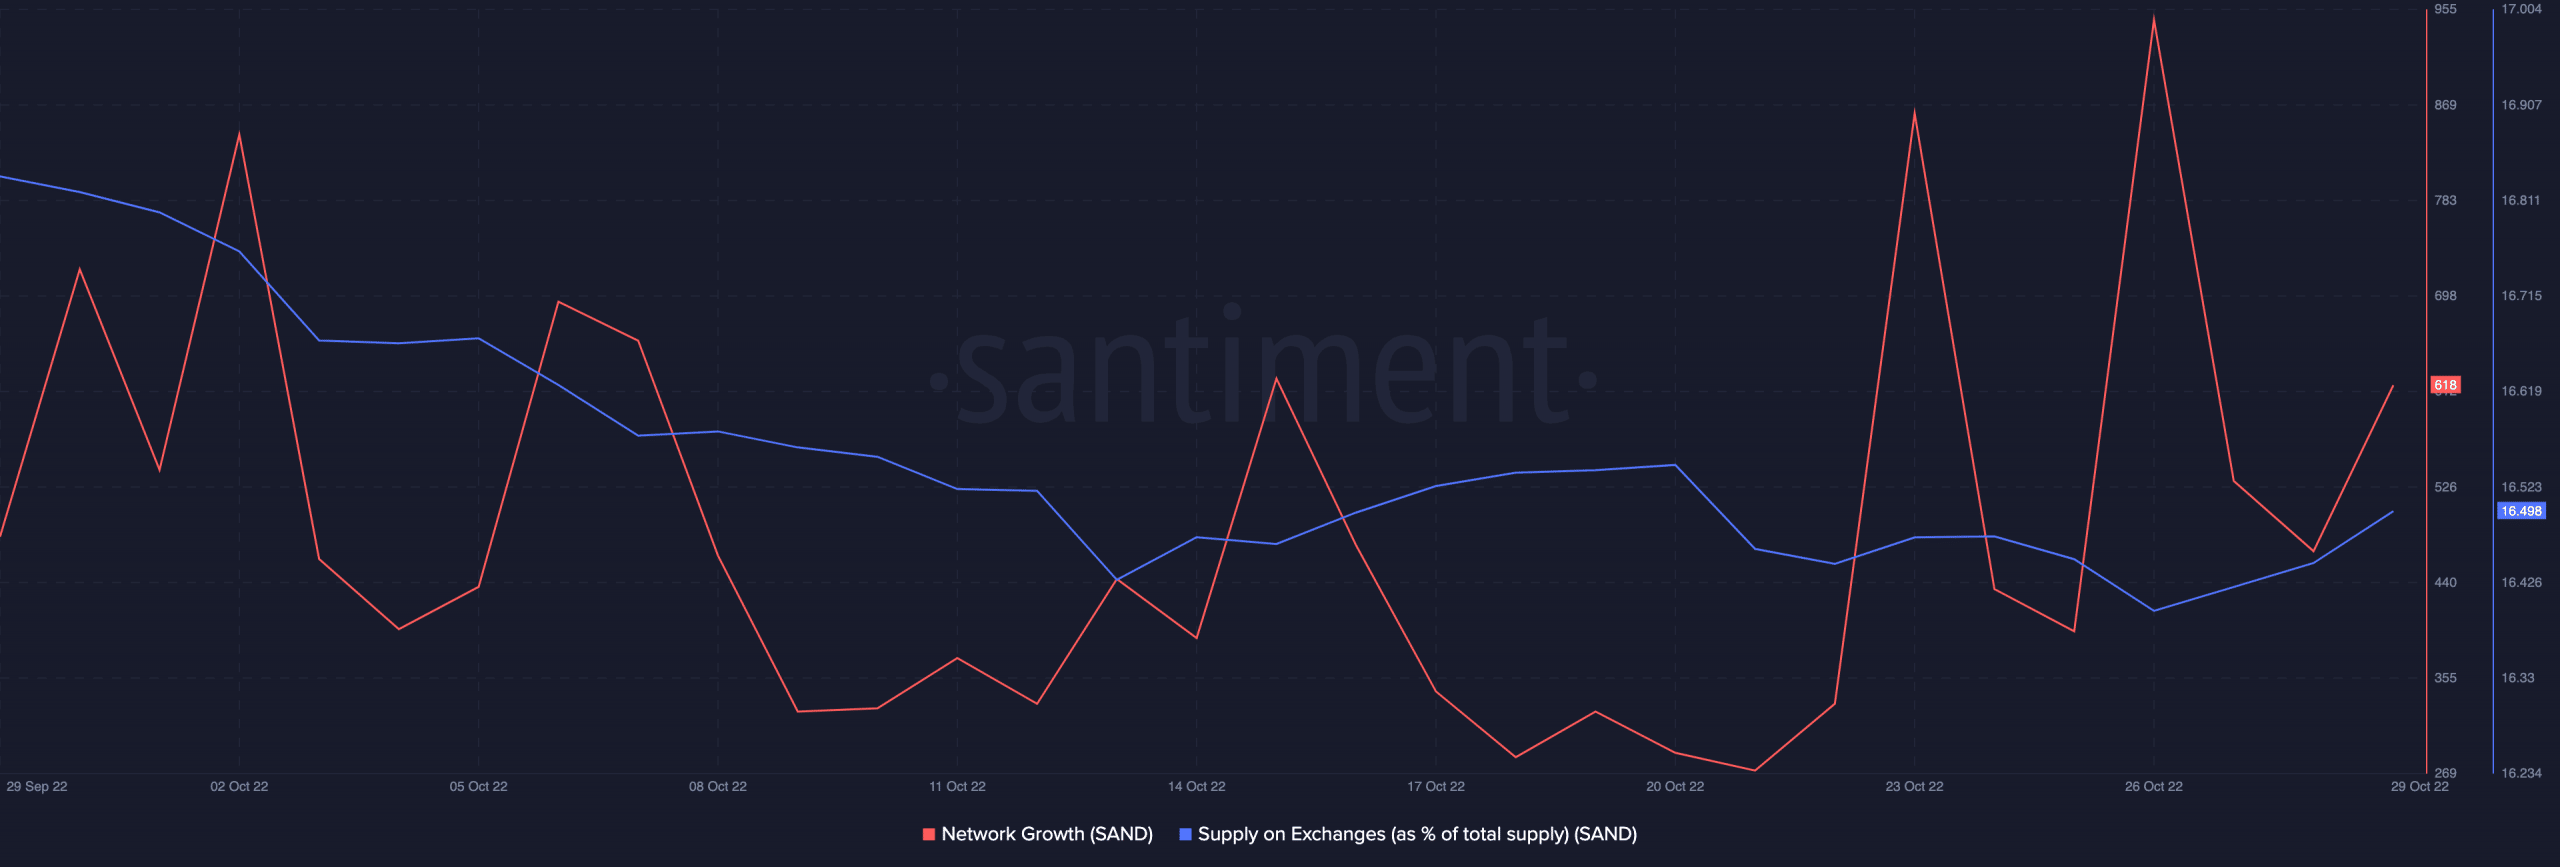
Besides the volume, SAND seemed to have attracted new investors. This was evident from the network growth increase. With the uptick in network involvement, SAND was likely to continue gaining traction from the crypto community. Nevertheless, it was necessary to consider the state of the exchange supply.
At press time, Santiment revealed that total exchange supply had risen to 16.49%. This increase meant that investors could be directing profits made from the past few days into the exchanges. As such, there was a high likelihood of selling pressure. So, investors might need to be extra careful in anticipating another series of upticks in the coming days.
Have traders taken advantage?
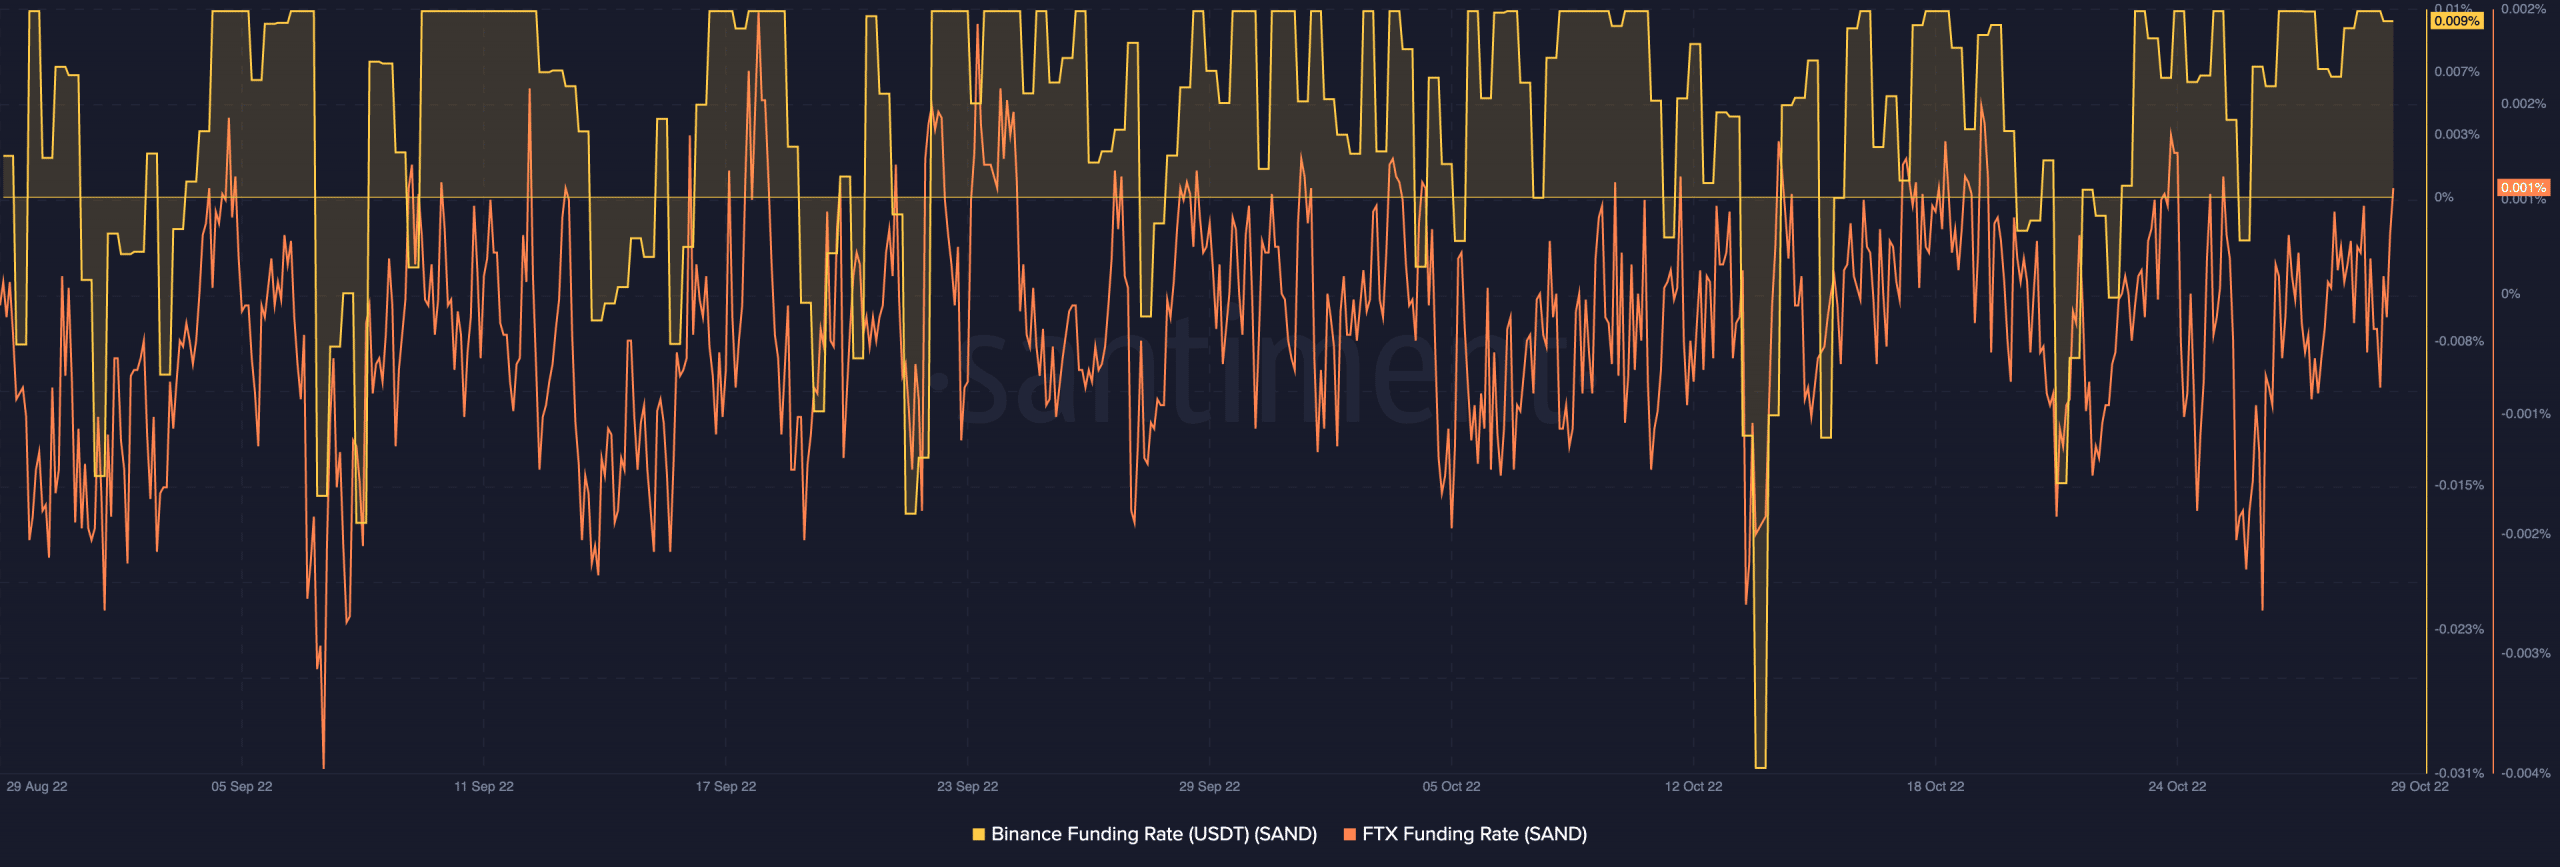
Considering the momentum displayed by SAND, one would expect that traders would have key into the “opportunity”. Interestingly, that was the case as Santiment showed that the Binance and FTX funding rates for SAND were in a positive state. This implied that futures traders were interested in taking advantage of the price swings to make profits.
Despite the uptick recorded, it seemed that liquidations were almost at par with both shorts and longs. According to Coinglass, about $1.4 million worth of SAND had been liquidated in the last 24 hours. However, the difference between both these opposite ends wasn’t much surprisingly.
At press time, shorts were liquidated at a little over $698,000. For long-position traders, it was $477,050. With this data, it might be mandatory for investors looking to profit more to watch their steps.
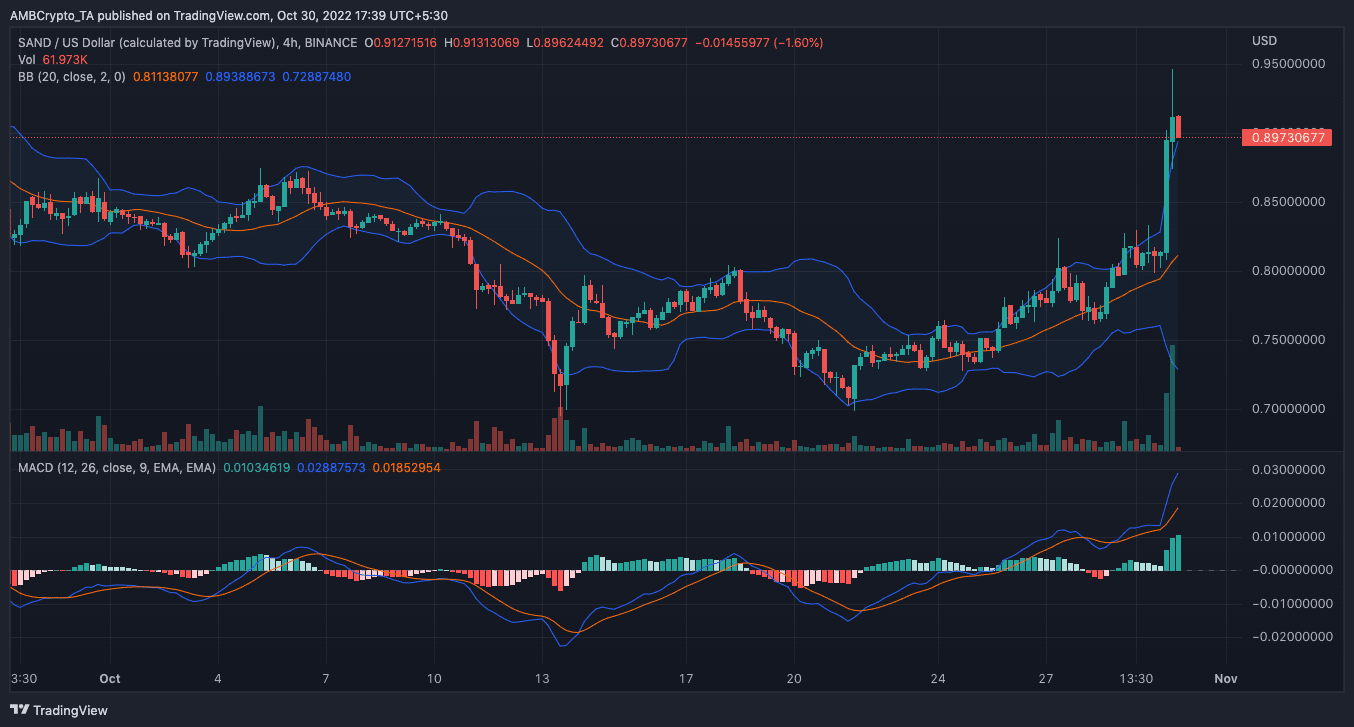
On the four-hour chart, SAND was showing extreme signs of volatility. Based on indications from the Bollinger Bands (BB), the highly volatile state exploded beyond its moderate state in the early hours of 30 October.
While this contributed to the price hike, it could also lead SAND down the charts. In addition, the Moving Average Convergence (MACD) revealed that the sellers (orange) were close to catching up with the buyers. In the case of meeting up or overtaking, SAND might halt its rally.


