Published 11 mins ago
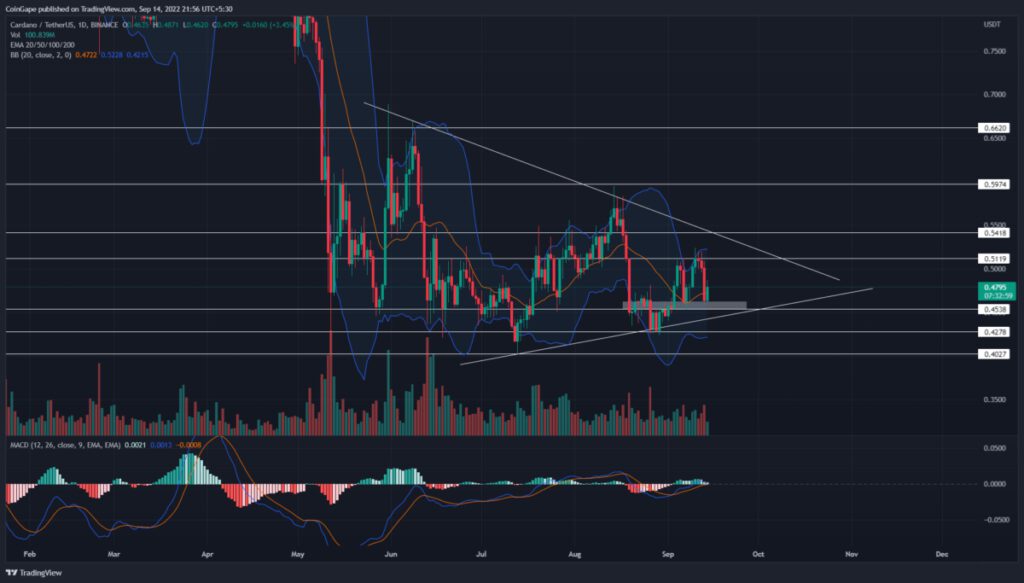
The Cardano(ADA) price resonated within a symmetrical triangle pattern over The past four months. The coin price wavering inside this pattern without any direction indicates a no-trading zone. Thus, the interest traders must wait for the breakout before positioning their funds in Cardano.
advertisement
Key points from Cardano analysis:
- Channel pattern breakdown indicates the continuation of the ongoing range-bound rally
- The coin buyers lose the dynamics support of the 20-day EMA
- The intraday trading volume in the ADA coin is $103.6 Billion, indicating a 104.6% gain.

Source- Tradingview
The ADA/USD daily time frame chart shows the formation of a symmetrical triangle pattern. Under the influence of this pattern, the altcoin is walking a lateral path and gradually narrowing its price spread.
The last bull cycle from the support trendline surged prices to the $0.512 resistance. However, the Cardano price has failed twice to surpass this barrier within a fortnight, indicating a high supply zone. Moreover, the recent sell-off in the crypto market bolstered the price reversal from the $0.512 mark and tumbled the market value by 9.6% to hit $0.46-$0.454.
Trending Stories
Today the Cardano price is 4% up and aims to resume the bull cycle higher. However, the bullish candle backed by low volume indicates weakness in underlying bullishness. Thus, the price will likely revert from $0.512 or the resistance trendline.
Thus, the moral of the story is that until the Cardano price is inside the triangle pattern, it will continue to follow a directionless rally and continue wobble from one level to another.
Therefore, the right time to trade this continuation pattern is when the price gives a decisive breakout from either trendline. Doing so will initiate a direction rally on the breakout side.
Technical Indicator
Bollinger band indicator: the Cardano coin moving above the indicator midline inside the current market price is higher than the average value as per the ongoing price range. Moreover, these mean lines may offer additional support to extend the price recovery.
advertisement
MACD indicator: the fast and slow lines wavering at the equilibrium zone indicates a neutral bias.
- Resistance levels- $0.512, and $0.542
- Support levels- $0.453 and $0.428
Share this article on:
The presented content may include the personal opinion of the author and is subject to market condition. Do your market research before investing in cryptocurrencies. The author or the publication does not hold any responsibility for your personal financial loss.


