The larger market crash on Friday saw the king coin drop to a 50-day low of $53.25K as a bearish sentiment finally took over the spot market. The dip was largely propelled by fears of the new coronavirus variant. It was even labeled as a “Black Friday” discount on BTC’s price across social media, as the top coin’s price oscillated near the lower $54K-$55K range for almost three days.
Finally, on the last day of November, BTC managed to recover as the coin saw over a 6% rise in price from the lower $53.25K level. BTC’s seemingly quick recovery could also be partly credited to the news of MicroStrategy acquiring 7,002 Bitcoin earlier this week at an average price of $59,187/BTC.
Along with that, German stock market operator Deutsche Boerse announced the listing of the Invesco Physical Bitcoin exchange-traded note or ETN which too aided the trend reversal. So, entering into the last month of 2021, as a trend reversal finally took place, can BTC do what the market expected it to?
When will the BTC’s supercycle happen
Wen moon? When will the supercycle take place? When will BTC finally hit $100K?
These are some questions doing the rounds in the crypto-verse for a while, but for now, Bitcoin hasn’t been able to enter the supercycle it was supposed to. Nonetheless, there are some indicators that assess BTC’s current trajectory and what to expect from it.
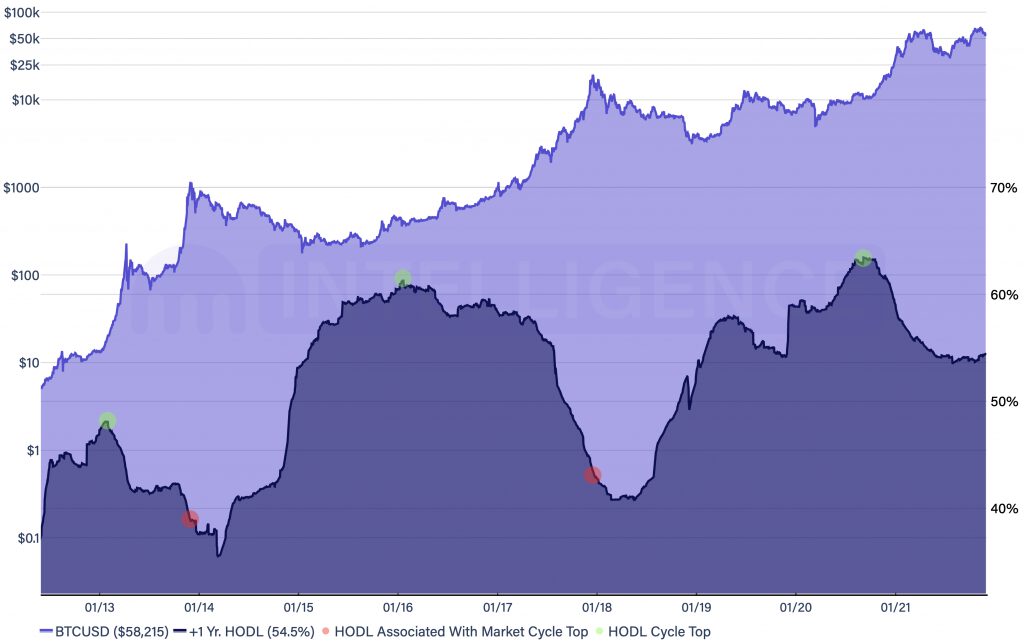
Looking at BTC’s +1 Year HODL Wave, historically, a local top in the indicator is consistent with a new bull market. When the number of untouched coins rapidly falls as price climbs, a new bull market may be underway. Approximately 54.5% of all coins in circulation haven’t moved in +1 year, down 8.9% from a local top of 63.4% set on 9 September last year.
The +1 Year HODL Wave’s reading, at the time of writing, noted a 5-month high in what appears to be the start of an uptrend. As per the aforementioned data, if the HODL Wave were to trend higher as price rallies, a new trend would have formed that could perhaps be indicative of BTC being in a ‘supercycle’.
In 2013, BTC’s +1 Year HODL Wave hit a local high of 48.2% and BTC was at $20.40. When BTC hit a cycle high of $1,158 in 2013-end the same measured 38.8%. Likewise in January 2016, the indicator hit a local high of 61.5% and BTC was at $380. When BTC hit a cycle high of $19,660 in December 2017, the HODL Wave reading was at 43.1%. Thus, a fall in the indicator alongside rising in prices could be the beginning of the much-awaited supercycle.
What will be the price targets?
The Logarithmic Growth Curve for Bitcoin presents two sets of curved regression trendlines, that have acted as critical support and resistance levels. One can establish when the coin is ‘overbought’ or ‘oversold’. As of now, BTC is a +87% to +141% move away from entering into ‘overbought’ territory, which stands between $108,910 and $140,375.
At a current price of $58,215, BTC resides in the 50 percentile of the logarithmic growth curve’s $24,651 – $140,375 range. If a supercycle follows, these price levels could be easy targets for the top coin.
For now, as recovery seems underway, BTC’s monthly close should be closely watched for the coin’s move ahead. Notably, the last dip took a toll on the market sentiment, despite the drawdown from ATH being one of the least severe ones, in 2021. This also says a lot about the price sensitivity among crowds of late. Nonetheless, BTC could redeem the bullish status soon enough with a higher monthly close.


