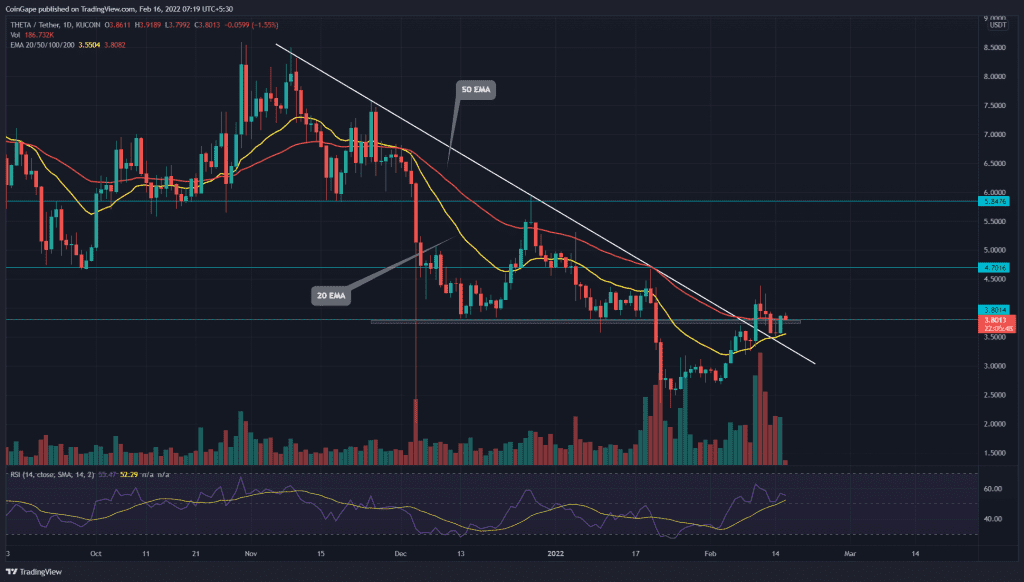
In less than three weeks, the THETA price registered a 90% gain hitting the $4.3 mark on February 11th. Moreover, the buyers knocked out the highly influential resistance trendline on February 10th, indicating the bull’s plans to initiate a recovery. The current retest phase should validate the sustainability of a bullish opportunity.
Key technical element to ponder
- The THETA buyers flipped the dynamic resistance of 50-day EMA to possible support
- The intraday trading volume in the Theta Network coin is $209 Million, indicating a 23.2% loss.
Source- Tradingview
A descending trendline was leading the recent correction phase in THETA price, which marked a new lower low of $2.2 on January 24th. Amid the widespread recovery in the crypto market, altcoin bounced back from the bottom support and breached the resistance trendline with a long bullish candle.
However, the coin price pulled back to retest this breakout level and check for sufficient demand. A morning candle pattern at the new flipped support suggests the sentiment has turned from selling at rallies to buying at the dip.
The Relative Strength Index(55) slope sustains at the bullish region, indicating the buyers have an upper hand.
THETA Buyers Acquires More Confirmation With $3.3 Breakout

Source- Tradingview
The THETA price rebounded from the descending trendline and pierced a shared resistance of $3.8 and 50-day EMA. Reclaiming the overhead resistance provides an extra edge to long traders. If the buyers sustain above this level, the altcoin would first rally to $4.6, followed by $5.7.
Alternatively, if the sellers pulled the coin price below the $3.8 and 20-day EMA, the sellers will take advantage of the fake-out and sink the altcoin to the immediate support of $3.25 or $2.45.
- Resistance-4.6 and $5.7
- Support level- $3.8 and 50 EMA


