Bitcoin and crypto market is always swinging with changes in the prices of tokens. The back-and-forth movement in prices remains the distinguishing factor that facilitates the speculative nature of the assets.
In some cases, the movement could be favorable for the investors, especially when the bulls are on the field. However, where the bears are at play, most tables are flipped upside down due to loss of funds and money.
The first half of 2022 brought an extreme winter within the crypto market. The situation became more intense with the collapse of the algorithmic stablecoin, Terra, and its native token, LUNA.
There have been losses of funds that run into billions of dollars for almost all the digital assets. Bitcoin and other crypto tokens seem to hold no track of their movement as they journeyed the southern route.
However, entering the year’s second half created a new phase for the leading cryptocurrency. The price of BTC started to appreciate in July and even at the beginning of August. But the recent price growth is short-lived as the bears have again taken over the crypto market.
During the past week, the crypto market witnessed more crumbling of most coins’ prices. The downtrend has been quite dramatic as the pattern keeps deepening as the days roll.
This has led to a massive slash in the cumulative market cap as the value dropped to almost about $1 trillion. The surprising movement of prices even gave a dip of $50 billion in the market cap in a single day.
Bitcoin MVR Tripple Ribbon Indicator
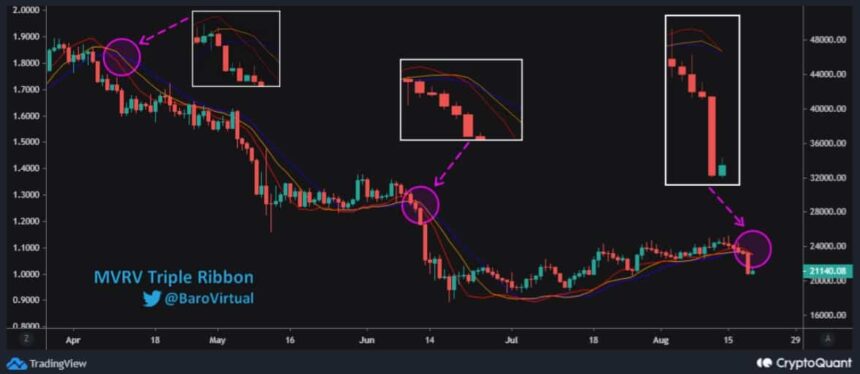
For Bitcoin, the story is getting more devastating as an indicator is predicting a potential further decline in price in the future. The indicator is the Bitcoin MVR Tripple Ribbon made of 3 moving averages (MAs). These are the 10-day, 15-day, and 20-day moving averages. It is used for gauging the average BTC price for some different periods.
A CryptoQuant analyst gave insight into the indicator and its potential outcome for BTC price. According to the analyst, the indicator provides signals foreshadowing Bitcoin’s fall. The analyst stated that there had been five full-fledged signals this year that displayed the weakness of BTC and its sell-off. The year has witnessed an average BTC sell-off of about 30%.
Over the past eight days, Bitcoin’s price drastically turned to the south. BTC has lost almost 14% over the period. The price of Bitcoin is hovering around the $21,000 region in the market.

Recall that BTC hit a new two-month high of $25,200. But the token suddenly plummeted to the $24,000 level. But the downtrend seemed to continue afterward as the token kept moving down from last week and even through this week.
The indicator is about to make a complete crossover at the press time. Such a previous move resulted in a 30% decline. So, getting a repeat of the process could push the price of Bitcoin beneath the $20,000 level.
Featured image from Pixabay, Charts from TradingView.com


