Be[In]Crypto takes a look at the five cryptocurrencies that decreased the most from March 11 to 18, with Terra (LUNA) dropping after its March 9 all-time-high (ATH).
These cryptocurrencies are:
- Anchor Protocol (ANC) : -26.63%
- Kadena (KDA) : -16.31%
- Terra (LUNA) : -14.82%
- Stacks (STX) : -13.96%
- Dash (DASH) : -7.96%
ANC
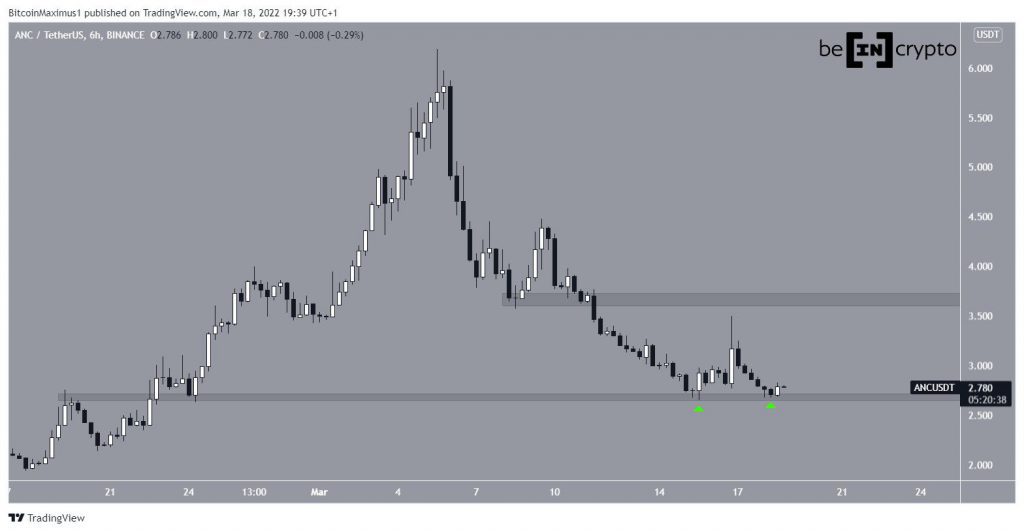
ANC has been falling since reaching an all-time high price of $6.19 on March 5. The downward movement has so far led to a low of $2.64 on March 15. This validated the $2.60 horizontal area as support.
After a brief bounce, the price returned to the same area on March 18, creating a double bottom pattern in the process (green icons). The double bottom is considered a bullish pattern, meaning that an eventual bullish reversal resulting from it would be the most likely scenario.
If one occurs, the closest resistance would be at $3.67.
KDA
KDA has been trading inside a symmetrical triangle since Jan. 22. The symmetrical triangle is considered a neutral pattern, meaning that both a breakout and a breakdown can occur.
KDA is approaching the projected end of this pattern, at which time a decisive movement is expected to occur.
Whether the price breaks out or down from the triangle will likely determine the direction of the future movement.
LUNA
On March 9, LUNA seemingly broke out above the $95 resistance area and proceeded to reach a new all-time high price of $104.80.
However, the upward movement could not be sustained and LUNA fell below the area after two days. On March 14, it validated it as resistance (red icon) and resumed its downward movement.
The next closest support area is at $78.
STX
STX has been decreasing alongside a descending resistance line since Oct 10.
On March 19, it made an attempt at breaking out, but was rejected by both the resistance lien and the $1.85 horizontal resistance area. This created a long upper wick (red icon) and pushed the price downwards.
Until STX manages to break out from both the line and the $1.85 resistance area, the trend cannot be considered bullish.
DASH
On Jan 21, DASH broke down (red circle) from the $118 horizontal support area. Previously, the area had been in place since June 2021.
The downward movement led to a low of $80.5 on Jan 24. Afterwards, DASH reached this level once more on Feb. 24, creating a double bottom pattern in the process (green icons).
Despite this being considered a bullish pattern, the trend cannot be considered bullish until DASH reclaims the $118 area.
For Be[In]Crypto’s latest Bitcoin (BTC) analysis, click here.
What do you think about this subject? Write to us and tell us!
Disclaimer
All the information contained on our website is published in good faith and for general information purposes only. Any action the reader takes upon the information found on our website is strictly at their own risk.


