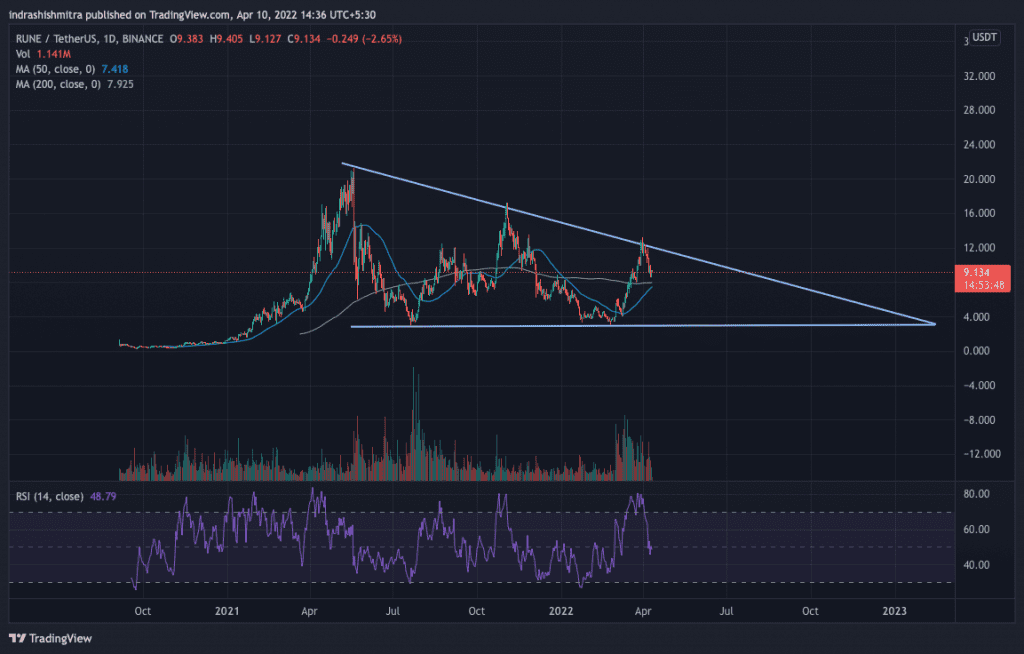
THORChain has seen better days, definitely. Back towards the end of October, it had rallied nearly 120% and recently over 200% due to the low base effect. But looking at the larger picture shows a slightly concerning situation for the coin. It attempts to solve a major issue in the cryptocurrency – primarily acting as a leaderless digital vault manager.
However, price action has been suffering for quite some time. Looking back, it can be observed that it had been following a downward triangle pattern even before the recent broader market correction that we saw beginning towards the end of 2021. And, this time again, it couldn’t manage to breach the downward trendline resistance and fell nearly 35% from the local top.
Does this fall signify a simple profit booked after a rally or the price action falling into the bearish pattern? Well, spoiler alert, on-chain metrics seem to suggest the former.
Confused?
One of the simplest metrics to measure on-chain activity is volumes. RUNE‘s recent rally was supported by healthy volumes on the blockchain and also the trading volumes. The post-rally cooldown is accompanied by relatively fewer volumes – suggesting optimism in market players.
The development activity for RUNE has also been on the rise. This coincided with the recent rally to make the local top in prices. It shows that the developers behind this project are somewhat serious about its future for the time being. It also indicates some new updates may be on the way.
Even social dominance for the coin is seemingly moving along with the rally. So what’s the verdict? These metrics happen to point towards a broader bullishness but despite all that, the descending triangle pattern on the charts can play spoilsport.
If only prices are able to breach through the diagonal trendline resistance of the bearish pattern can some renewed optimism be expected. But until then, buying in small quantities with strict stop losses in accordance with comfortable levels of risk/reward can be considered.


