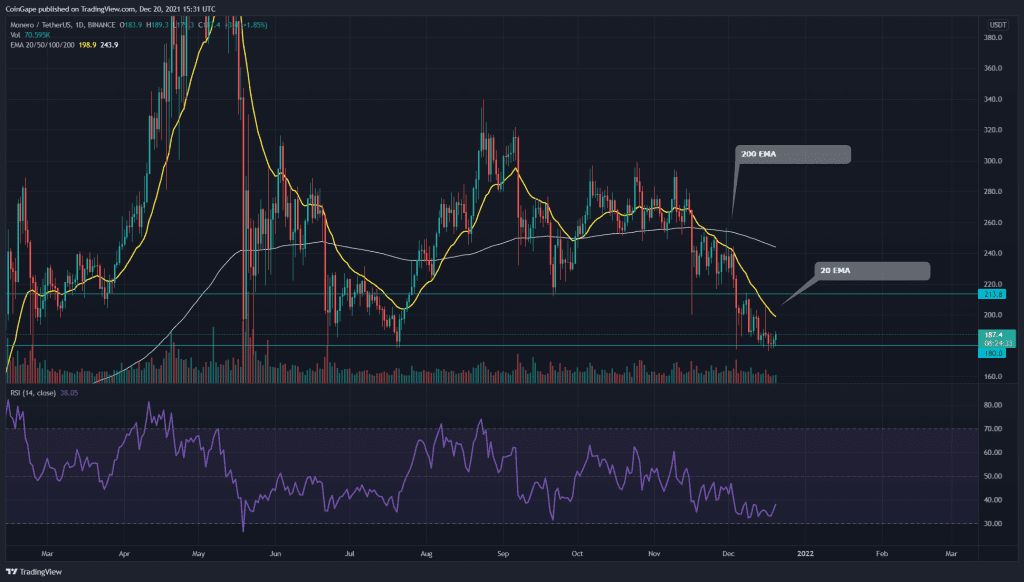
The aggressive selling in the RUNE token price has taken a break now. The pair halts at a $6.4 support, where the battle between the buyers and sellers has caused a sideways rally in the lower time frame chart. The crypto traders should wait for more price action data if they are looking for a long trade, as the current trend for Thorchain still maintains a red flag.
RUNE/USD Daily Time Frame Chart
Source- Tradingview
Past Performance or Trend-
The RUNE coin displayed a remarkable rally in October, which made a new higher high around $17.25. However, the strong sell-off in November and December completely nullified all the gain price gathered in the bull run and plugged the token back to the $6.4 mark.
Thorchain chart displays death crossover of the crucial 50-and-200day EMA
On December 4th, the sudden selling pressure dropped the coin price to $6.4. Since then, the pair has been hovering above this bottom support, trying to identify sufficient demand pressure. The retracement phase has brought around a 66% discount on the token value.
The Thorchain coin is still trying to sustain above the support, indicating a small Doji-type candle. For this token to signal proper bullish reversal, the price needs to breach the nearest resistance of $7.1, providing an entry opportunity for the traders. However, the current trend for this token is still bearish, and therefore the crypto traders entering a long trader should strictly follow their risk management.
By press time, the Thorchain token is trading at 6.38, with an intraday gain of 7.58%. The 24hr volume change is $67 Million, indicating a 141.8% hike. As per the coinmarketcap, the token stand at 70th rank with its current market cap of $$1,765,217,575(+8.89).
Technical Indicators-
- The 4-hour Relative Strength Index (57) indicates bullish divergence in its chart, projects the rising strength of the token buyers.
- The RUNE token trades in a bearish trend concerning the crucial EMAs (20, 50, 100, and 200). Moreover, the 50 and 200 EMA gives death crossover, encouraging the ongoing selling in the coin market.


