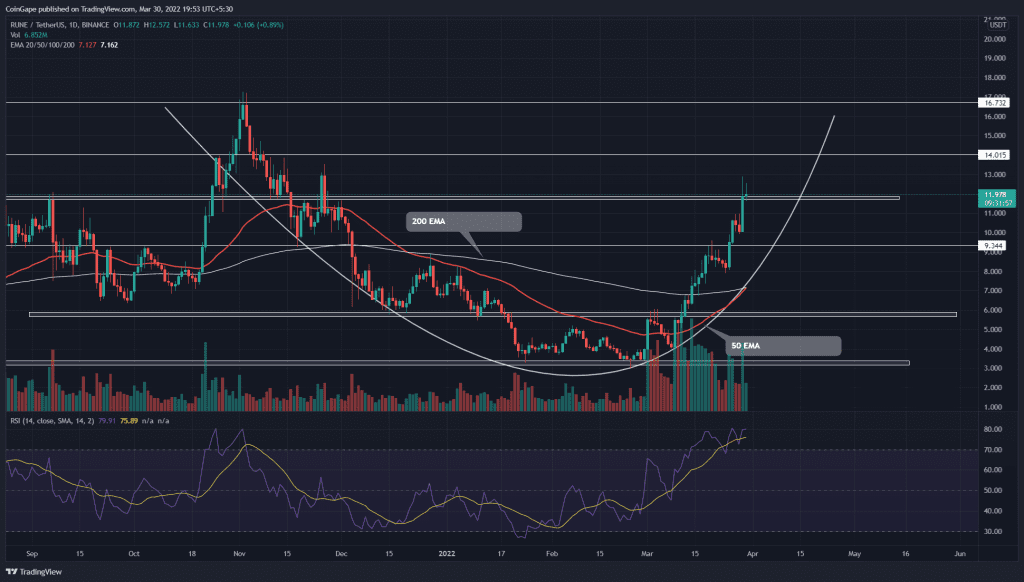
Since the latter half of March, the cryptocurrency market has adapted a recovery sentiment. With increasing underlying bullishness, the RUNE buyers breached a few important resistances such as $5.8, $9.2, and now $11.8. Can buyers sustain the fresh breakout for another leg up?
Key points
- RUNE price forming a rounding bottom pattern in the daily time frame chart
- The buyers are struggling to sustain above the $11.8 mark
- The 24-hour trading volume in the Thorchain coin is $391.2 Million, indicating a 5.97% loss.
Source-Tradingview
The THORChain(RUNE) buyers escaped from its accumulation phase on March 12th, with a decisive breakout from $5.8 resistance. The post-retest rally soared 42% by forming six consecutive green candles and reached the $9.3 mark.
After a minor pullback, the renewed buying pressure breached this overhead resistance($9.3), followed by $11.8. As a result, the RUNE price has registered a 200% gain since the beginning of March.
Today, the altcoin retested the $11.8 mark to obtain sufficient demand for further rally. However, the long-wick rejection attached to daily candles suggests sellers are aggressive on a higher level.
If RUNE sellers force a candle closing below the $11.8 mark, the traders can expect a minor correction to the $9.25(0.328 Fibonacci retracement level) or $8 mark(0.5 FIB).
Contrary, if buyers could sustain above the $11.8 mark, the follow-up rally could hit an 18% high $14 resistance.
Technical indicators:
The recovery rally has retrieved the crucial EMAs(20, 50, 100, and 200), suggesting the buyers are back in the driving seat. Moreover, a golden crossover among the 50-and-200-day EMA lures more buyers into the market.
The vortex indicator widens its gap between the VI+ and VI- slope, indicating strong bullish momentum.
- Resistance levels: $14 and $16.7
- Support levels: $9.3 and $8


