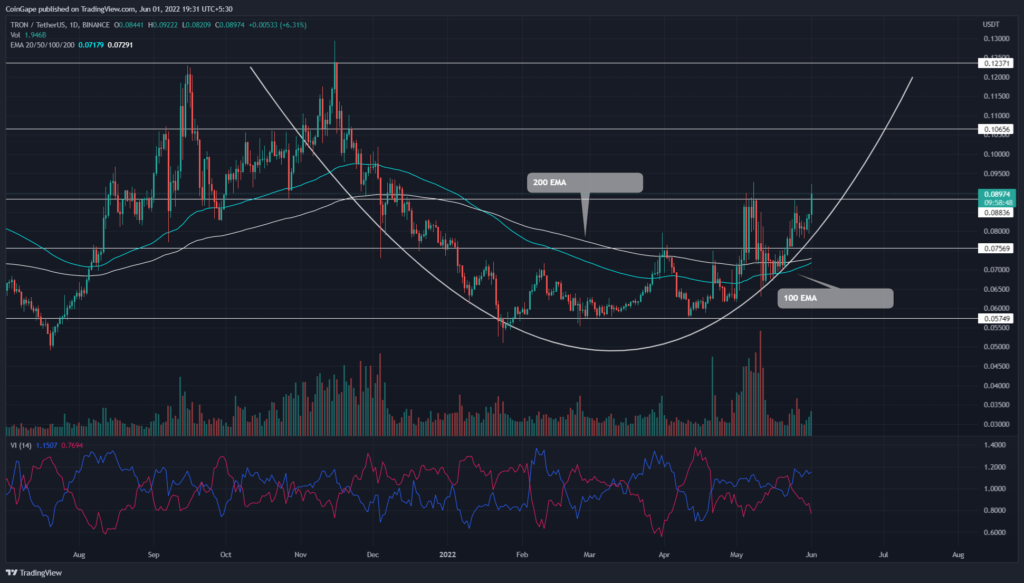
The TRX/USDT technical chart shows the formation of a rounding bottom pattern in the daily time frame chart. After the accumulation phase during the first four months of 2022, altcoin moves to its next recovery phase, which strikes the $0.088 resistance.
advertisement
Key points
- The TRX price has increased 35% in the last three weeks.
- The TRX chart shows a potential bullish crossover of 100-and-200-day EMA
- The 24-hour trading volume in the TRON coin is $1.46 Billion, indicating a 52.61% hike.
Source-Tradingview
May 2022 was quite disturbing for many crypto holders as even some major cryptocurrencies faced a significant sell-off and slumped to new lows. However, fighting off this widespread negative sentiment, the Tron coin has impressively protected its value during the crisis.
The last correction cycle initiated on May 9th tumbled the TRX price by 28% after hitting the $0.063 mark. Following a minor consolidation near this support, the bullish momentum started to kick in again and raise the coin price higher.
Trending Stories
On May 22nd, a bullish breakout from $0.075 resistance signaled a recovery phase which drove the TRX price 17.6% higher to $0.088 resistance. Today, the altcoin witnessed a significant inflow and pumped 8% on the intraday level.
The price jump breached the $0.088 resistance, suggesting the buyers were ready for another leg-up. A daily candlestick closing above the $0.088 mark would accelerate the buying pressure and surge the coin price 20% higher to $0.106.
Furthermore, the rounding bottom pattern forming in the daily time frame chart should eventually lead the TRX price to the $0.123 mark.
Technical indicator
The 100-and-200-day EMA slopes nearing a bullish crossover signals growth in the underlying bullishness. This crossover would provide additional confirmation for buyers to hold their coins longer.
advertisement
Moreover, the expanding gap between the VI+ and VI- slope shows sustained buying from traders.
- Resistance level- $0.103 and $0.123
- Support levels- $0.088 and $0.075


