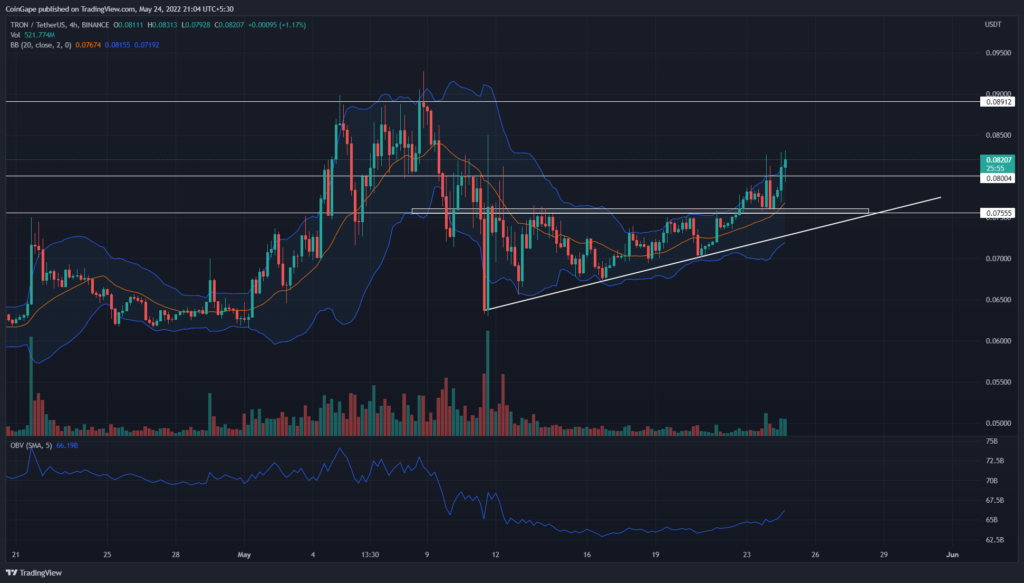
After a consolidation phase of eleven days within an ascending triangle pattern, the TRON(TRX) price breached the neckline resistance on May 22nd. Following a retest phase, the coin price rose 8% higher and trades above the support level of $0.080. This support aligned 20-day-EMA, and a rise in trading volume suggests a strong bullish momentum. However, will this suffice to see a start to a new bull rally?
Key points
- The TRX price escaped an ascending triangle pattern with a bullish breakout on May 22nd.
- The TRX chart shows a bullish crossover of the 20-and-200-day EMA
- The 24-hour trading volume in the TRON coin is $1.6 Billion, indicating a 58% gain
Source-Tradingview
From the past swing high on May 8th, the TRON(TRX) price fell 32%, down to $0.063 in a span of three days. The TRX coin has ever since consolidated in an ascending triangle while taking support of the dynamic trendline. On May 22nd, the price witnessed a breakout above the $0.075 overhead resistance and hit back for a retest the very next day.
The post-retest rally gained 8% and surged above the $0.080 level. At this point, the 20-day-EMA and the immediate support of $0.080 act as good support zones. Furthermore, the surge in the volume activity, i.e., 58%, ensures a healthy bullish momentum.
Thus, If the bullish momentum sustains, the TRX coin could make $0.089 as its new target, retesting its previous high.
Trending Stories
However, failing to do so could lead the price to break through multiple supports and down to the ascending trendline.
Technical indicator
Bollinger band: The TRX price pokes the upper band of the Bollinger band indicator, suggesting aggressive buying from traders. However, this over-extended buying may need a minor correction before continuing the ongoing rally.
OBV indicator: The rising OBV slope accentuates the buyer’s interest in continuing the bull run.
- Resistance level- $0.089 and $0.092
- Support levels- $0.080 and $0.075


