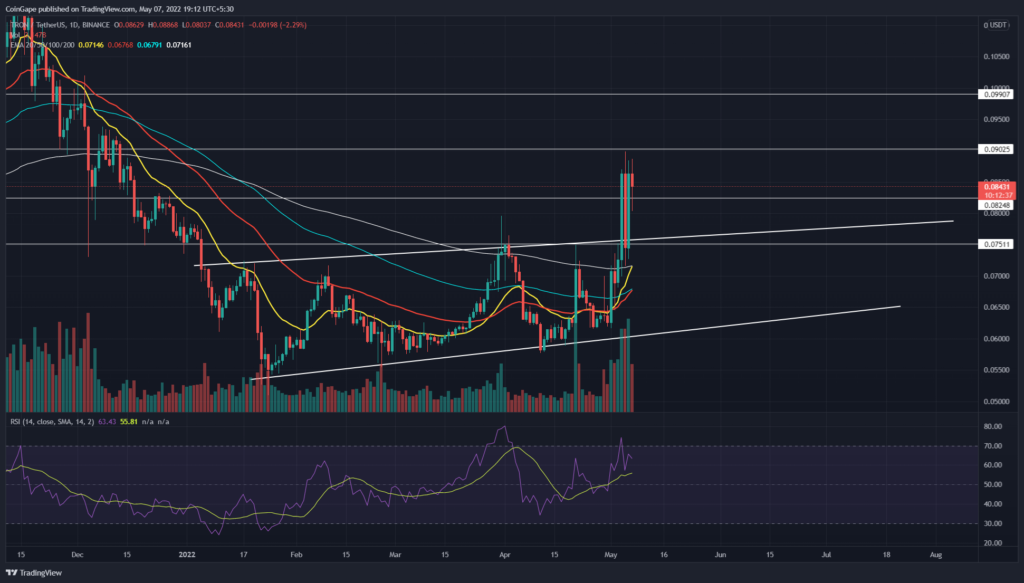
The TRON(TRX) price escaped a three-month-long consolidation phase with a bullish breakout from the resistance trendline of the inverted flag pattern. The breakout rally tagged an overhead resistance of $0.09 and reverted to a retest phase; however, the RSI indicator suggests weakness in the bullish momentum despite a strong follow-up candle.
Key points
- The TRX price has gained 33% since the last week
- The TRX chart shows a double bullish crossover among crucial EMAs(20, 50, 100, and 200)
- The 24-hour trading volume in the TRON coin is $3.4 Billion, indicating a 1.2% gain
Source-Tradingview
The TRON(TRX) price resonated in an inverted flag pattern channel over the past three months, threatened the possibility of extending the prevailing downtrend.
However, amid launch of a new stablecoin USDD from TRON ecosystem, the buying interest in this altcoin has sharply risen. As a result, the TRX price gave a deceive breakout from the rising channel on May 4th, suggesting a recovery opportunity for TRON holders.
However, the following retest day of equal length teases weakness to this bullish momentum.
Trending Stories
Furthermore, the post-retest rally has surged the TRX price by 16.5% and breached the near resistance of $0.0882. Today, the TRX price is down by 4% and provides another entry opportunity for interest traders, with altcoin sustaining above the $0.088 mark.
The potential rally would drive the coin price 20% higher to the $0.1 psychological mark.
Technical indicator
The TRX price shows a simultaneous bullish crossover between 20-and-200-day EMA and the 50-and-100-day EMA. The double crossover provides a strong buy signal, boosting the continuation of a bullish rally.
However, the daily-RSI shows a significant bearish divergence, indicating the coin price may offer a minor correction to the $0.075 mark before continuing the bull run.
- Resistance level- $0.09 and $0.1
- Support levels- $0.082 and $0.071


