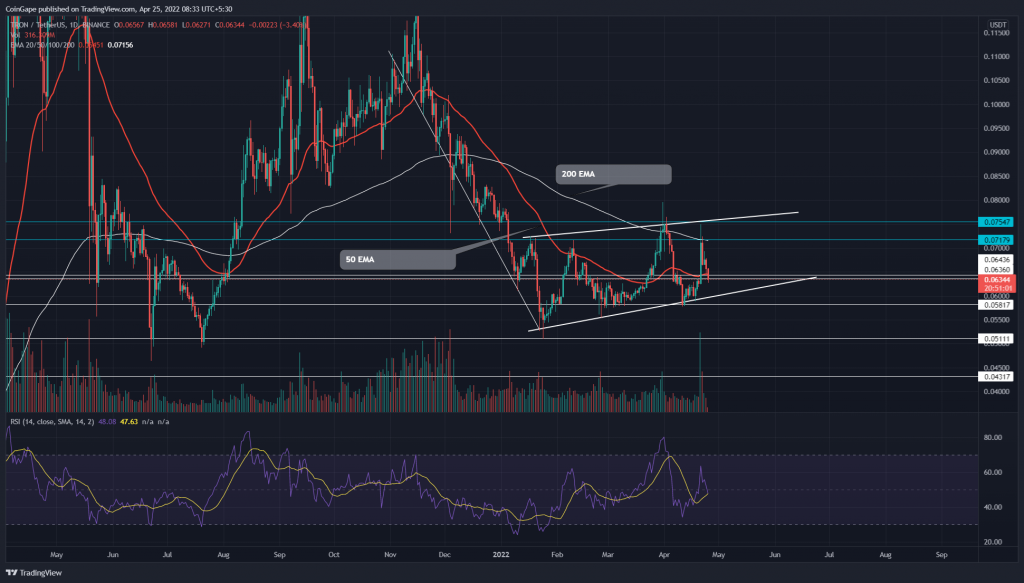
The TRON(TRX) price reverted from the $0.075 resistance and triggered a new bear cycle within an inverted flag pattern. This continuation pattern could extend the prevailing downtrend if buyers lose the dynamic support trendline.
Key points
- The TRON price plunged below the EMAs support(20, 50, and 100)
- The inverted flag pattern fallout could descend the TRX price by 15%
- The 24-hour trading volume in the TRON coin is $781.8 Million, indicating a 4.7% loss
Source-Tradingview
Last week, the TRON(TRX) price witnessed significant growth, pushing the altcoin to the $0.075 mark. This bull cycle was accelerated by a recent announcement from founder Justin Sun regarding plans to launch a decentralized algorithmic stablecoin-USDD. In just four days, the coin price accounted for 25% ROI from the $0.06 support.
However, the bulls were exhausted from the sudden rally displayed by a higher price rejection candle. Under the influence of the inverted flag pattern, the TRX price turned down from the overhead resistance and tumbled 16%.
The bears knock down the crucial EMAs (20, 50, and 100) support, charging straight to the bottom support trendline. However, the bearish inverted pattern would bolster the continuation of the prevailing downtrend and dump the TRX price to the $0.05 mark.
Trending Stories
However, the altcoin will rebound from the support trendline if bullish momentum revives at the dynamic support trendline.
Technical indicator
The TRX buyers failed to follow up on the bullish crossover of the 20-and-50-day EMA. As a result, the sellers took advantage of the situation and regained a negative alignment in these EMAs.
The RSI slope nosedive beneath the equilibrium and 14-SMA line suggests a negative sentiment among traders.
- Resistance level- $0.062 and $0.071
- Support levels- $0.058 and $0.0511


