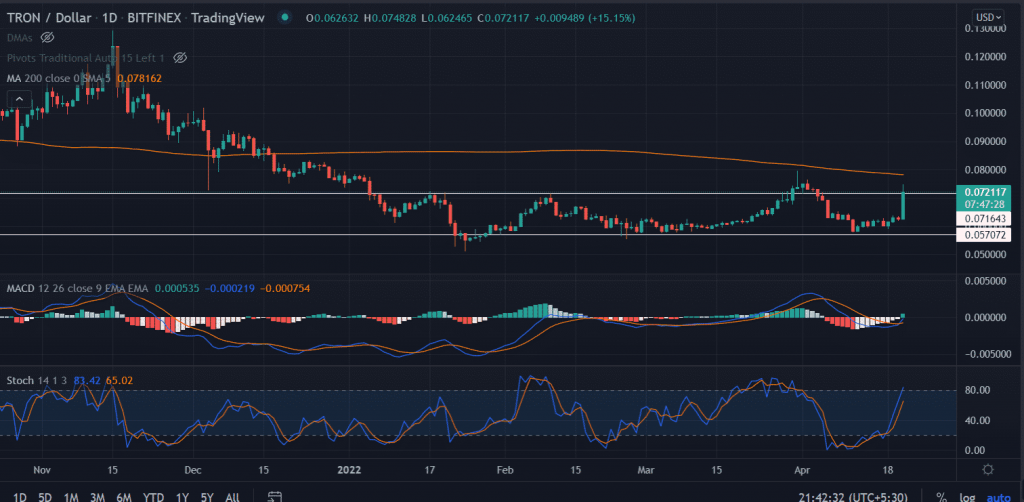
TRON price edges higher following the previous sessions of consolidation. The price opened lower but quickly retraced back to the day’s high which is also the weekly high. Investors expect more gains on a daily close above $0.071.
- TRON price prints impressive gains on Thursday with more than 15% gains.
- A strong green candlestick indicates more gains if the price pierced the 200-EMA.
- The momentum oscillator tilt in the favour of bulls.
TRON price seeks more gains
On the daily chart, the TRON price has been trading in a short-term trading range of $0.057 and $0.071 since January 7. The price continues to slide inside the boundaries with a few deviations on January 24 and March 31 respectively. TRON’s price dropped nearly 70% from the swing highs of $0.12 made on November 15 to the swing lows of $0.05.
Currently, the TRON buyers attempt to break above the range but face some pressure near the upper boundary of the range that is placed near $0.071. A sustained buying pressure would push the price to test the critical 200-day exponential moving average (EMA) at $0.078 another upside filter for the bulls to cross.
If the price successfully holds above the mentioned level then a psychological $0.08 would be the next target for the TRON price.
On the flip side, a daily candlestick below $0.060 would invalidate the bullish hypothesis for the asset. In that case, the first downside target could be located at the lower boundary of the predefined range at $0.057.
Trending Stories
As of writing, TRON/USD trades at $.0.071, up 13.85% for the day.
Technical indicators:
MACD: The moving average convergence divergence crossed above the midline with a strong bullish bias.
Stochastic Oscillator: The bounded oscillator hovers near the overbought zone but is still off from the overheating condition.


