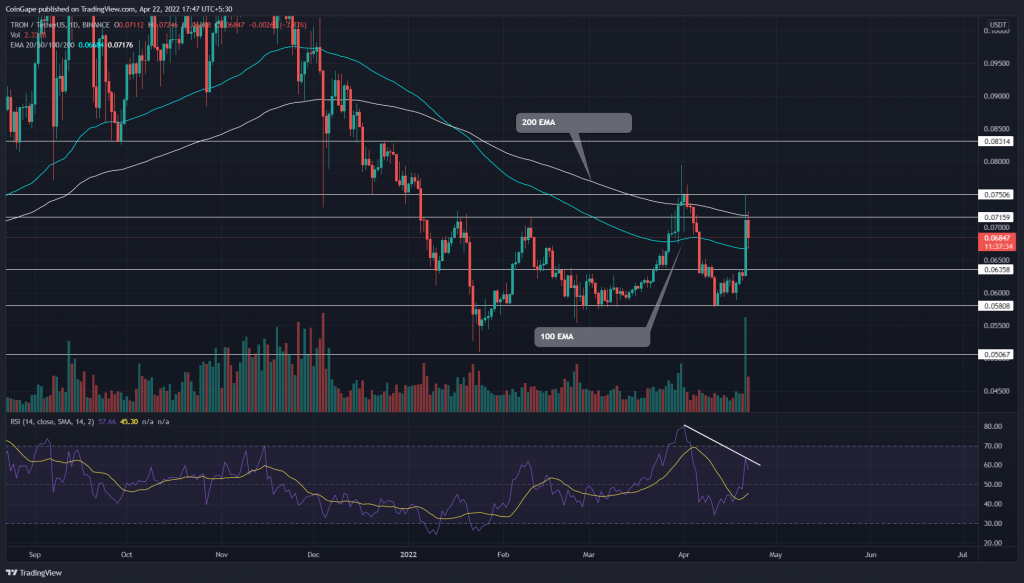
The (TRON)TRX price witnessed a sudden 13% pump on April 21st, as founder Justin Sun revealed plans to launch a decentralized algorithmic stablecoin-USDD. The announcement spiked the coin price to the local resistance of $0.0716; however, the buyers couldn’t manage a breakout. Today, the altcoin is down by 4.79% and may retest the reclaimed EMAs for support.
Key points
- The TRON chart displays morning star forming in the weekly chart
- The 200-day EMA stalls the price recovery
- The 24-hour trading volume in the TRON coin is $3.78 Billion, indicating a 242.8% gain
Source-Tradingview
The recent correction phase in the crypto market had plunged the TRX price to the $0.058 support on April 11th. This support zone initiated the march rally and pumped the coin to the $0.0751 mark.
Thus, history repeated itself, and the TRX price rebounded from this support with an inside day candle. The new reversal rally got a strong push from the launch announcement of decentralized stablecoin-USDD and encouraged a significant inflow.
The bull run tagged the $0.0751 resistance level but provided a closing below the neighboring resistance level of $0.0716. The sellers put more pressure on TRX price resulting in a 4.77% today, where it currently trades at $0.067.
Trending Stories
The potential reversal may face multiple resistance on the downside mounted by the regained EMAs(20, 50, 100) and $0.064 support.
advertisement
However, the price action has maintained a sideways rally since the December-January bloodbath, and a bullish breakout from the $0.083 resistance is needed to confirm a genuine bull run.
Technical indicator
The TRX price is struck between the 200-day EMA resistance and the 100-day EMA support. Moreover, the rising 20-day EMA performs a bullish crossover with a 50-day EMA, which may assist buyers in pushing the price higher.
The RSI slope showed a considerable yet relatively shorter jump than price action. The bearish divergence between the April 1st and April 21st hits some weakness to the bullish momentum
- Resistance level- $0.0716 and $0.075
- Support levels- $0.063 and $0.058


