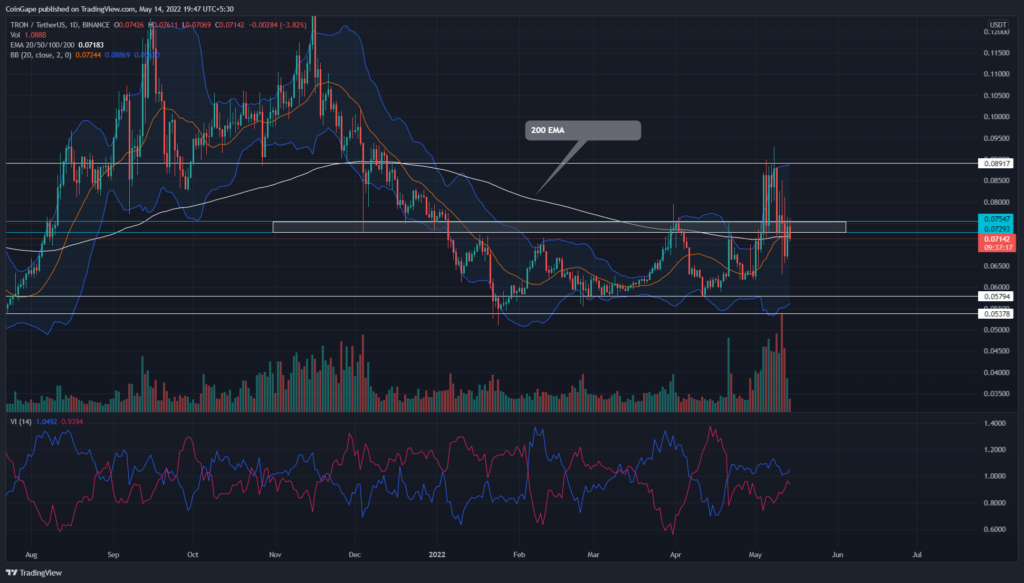
The failed attempt from the TRON (TRX) buyers to escape the range-bound rally indicates a potential downfall to the $0.057 mark. The $0.075 fallout brings a short opportunity for interested traders to take an 18% target. Can the concentrated EMAs stall the upcoming freefall?
Key points
- The TRX price has lost 16% since the last week
- The TRX chart shows a potential bearish crossover of 20-and-200-day EMA
- The 24-hour trading volume in the TRON coin is $1.77 Billion, indicating a 21.5% loss
Source-Tradingview
The TRON(TRX) price has resonated in a horizontal channel since the beginning of 2022. During the consolidation phase, the coin comfortably bolstered itself at the $0.057 support making several attempts to push its way through the $0.0748 resistance.
The constant accumulation of buyers over the past five months and their efforts to break the horizontal channel finally saw success on 4th May and reached a high of the $0.9 mark.
However, the buyers couldn’t sustain this breakout amidst the recent crash in the crypto mark and succumbed to the daunting horizontal channel once again. The TRX price currently trades at $0.716, with an intraday loss of 3.51%. The support fallout suggests the TRX price would descend 18.7% lower to retest $0.057 support.
Trending Stories
On a contrary note, all this fuss has accumulated the crucial EMAs(20, 50, 100, and 200) near the $0.075 mark, which may interrupt further downfall and push the price back above $0.75
advertisement
Technical indicator
The TRX/USDT pair pierced through the midline of the Bollinger band indicator gives additional confirmation for descending to the lower support band situated near $0.57.
The vortex indicator shows the VI+ and VI- slope is poised to bearish crossover. This sell signal may bring additional sellers and bolster the expected 18% fall.
- Resistance level- $0.074 and $0.088
- Support levels- $0.057 and $0.053


