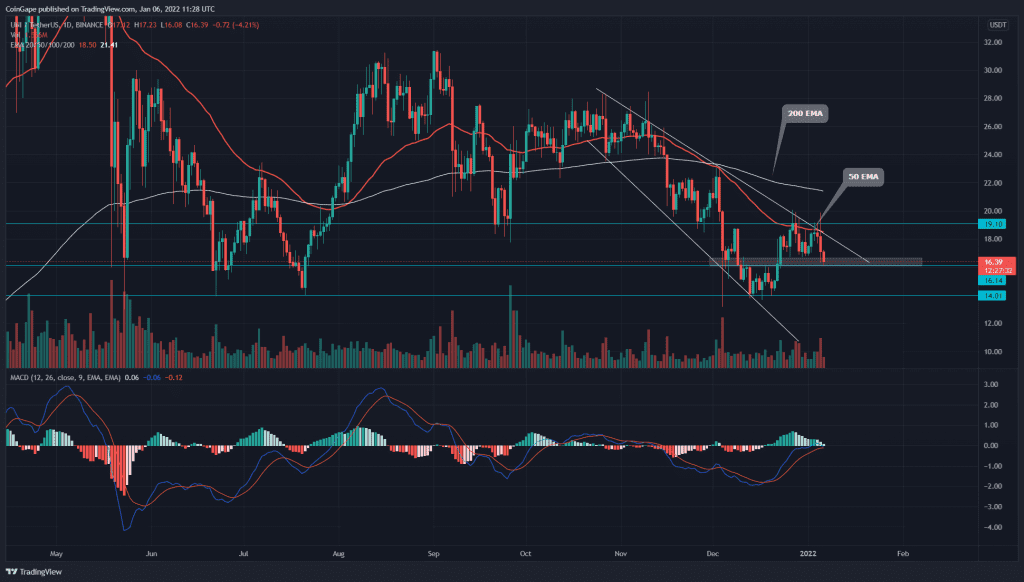
After bouncing from the $14 support, the UNI token price obtained strong bullish momentum aiming to escape the falling wedge with a bullish breakout. However, the price could surpass the descending trendline, which dumped the price back to the bottom levels.
UNI Key technical points:
- The 50-day EMA line provides dynamic resistance to UNI token
- The 24-hour trading volume in the Uniswap token is $654.4 Million, indicating a 52.6% gain.
Source-Tradingview
As mentioned in our previous article on the Uniswap token, this pair resonated in a descending broadening wedge pattern of the daily time frame chart. During the last few weeks of 2021, the price showed an impressive recovery from the $1.4 mark and positive signs from the technical indicators.
However, a confluence of major chart levels like $19.13, descending trendline, and 50 EMA exerted strong selling pressure in the UNI token, resulting in a bearish reversal.
This recent sell-off has dropped the token price below the 20 EMA line, reclaiming the bearish sequence among the crucial EMAs. Moreover, the coin price faces strong resistance from the 50 EMA line.
The daily moving average convergence/divergence indicator showed both the MACD and signal line were on the verge of crossing above the neutral zone. However, the new red candles in the chart are again pushing these lines back to the bearish region.
Uniswap Token Shows A Double Bottom Pattern In The 4-hour Time Frame Chart.
Source- Tradingview
The crypto market experienced some sudden selling pressure in these last two days. This sell-off pushed the price action to form a double bottom pattern. The neckline for this pattern is $16.14, and the price is currently hovering above this support.
If the price breaks down from this support level, the crypto traders can grab a quick short trader, with the price expected to retest the $14 mark.
The important supply zone for Uniswap token is at $19.1, followed by $22.8. And for the opposite end, the strong demand pressure can be expected from $16.4 and $14.


