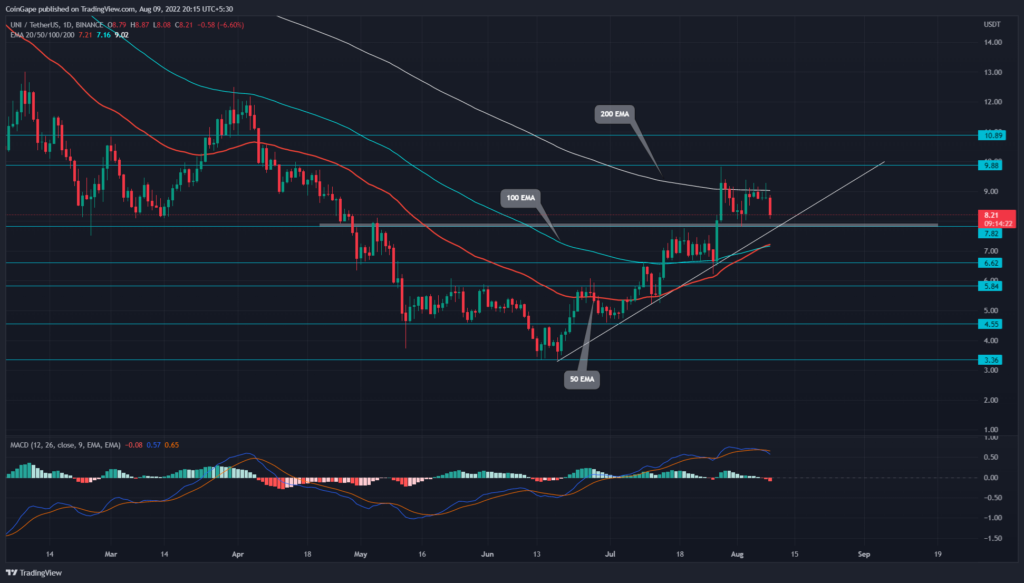
On June 18th, the UNI/USDT pair bounced from the $3.36 mark and initiated a new recovery rally. Following an ascending trend line, this bull run rose 188% as it reached a record high of $9.74. However, the recent post-correction rally failing to breach the proper swing high indicates weakness in bullish momentum. Moreover, in response to the double top pattern, the altcoin is threatened to lose the $7.82 support.
advertisement
Key points:
- The UNI traders can maintain a bullish bias as the price sustains above the ascending trendline.
- The 50-and-100-day EMA shows a bullish crossover may accelerate the bullish momentum
- The 24-hour trading volume in the Uniswap token is $177.9 Million, indicating a 9% gain.
Source-Tradingview
The Uniwasp (UNI) buyers have struggled to surpass the $9.3 mark over the past two weeks. The multiple higher price rejection candle at this level reflects profit booking from the short-term traders.
Thus, with sustained selling, the UNI price tumbled 12% in the past two days, revealing the formation of a double top pattern. Under the pattern influence, the altcoin may drop another 5% to retest the $7.82 neckline support.
Trending Stories
However, along with $7.82, the expected downfall may hit the ascending trendline at the same level, forming confluence support for buyers. If UNI buyers sustain this combined support, the coin price may revert 13% higher and rechallenge the $9.3.
On a contrary note, if the traders follow the bearish pattern and break down from the prior swing low support of $7.82 and long-coming support trendline, the coin price may witness a significant correction. The potential downfall may drop the altcoin 15% lower, hitting the $5.81 support.
Technical indicator
EMAs: the UNI price reverted from the 200-day EMA near the $9.3 mark, indicating the overall trend is still bearish. However, a bullish crossover of the 20-and-50-day EMA may fuel the post-correction rally to surpass the $7.8 resistance.
advertisement
MACD indicator: A sell signal from the bearish crossover of the fast and slow line bolsters the price correction to breach the $7.82 neckline. However, these slopes above the midline indicate the traders fell positive for this coin.
- Resistance levels- $9.3, $10
- Support levels are $7.82 and $6.62


