Uniswap [UNI], as of 2 November, was the topic of discussion in the crypto community. This was because the network registered promising gains lately. Furthermore, according to CoinMarketCap’s data, UNI was among the top gaining cryptos as of 1 November.
🏆TOP Gainers in last 24hrs according to CoinMarketCap
🥇 $DOGE
🥈 $XCN
🥉 $TON
4⃣ $UNI
5⃣ $APT
6⃣ $ELGD
7⃣ $SHIB
8⃣ $SNX
9⃣ $HOT
🔟 $CHZ▶️ Source: @CoinMarketCap
🔔 For more: Click #cryptoLeadersreviews #cryptoLeader#gainwithLeader
▶️ Join us for more: @Crypto_LeaderTM pic.twitter.com/9Vf2fChqY5
— Crypto Leader (@CryptoLeaderTM) November 2, 2022
_____________________________________________________________________________________
Here’s AMBCrypto’s Price Prediction for Uniswap [UNI] for 2023-2024
_____________________________________________________________________________________
The confidence in UNI grew further when whales showed interest in UNI. According to WhaleStats, a crypto whale activity tracking platform, UNI was on the list of cryptos that the top 1,000 Ethereum whales were holding.
🐳 The top 1000 #ETH whales are hodling
$103,392,245 $SHIB
$75,234,130 $LOCUS
$72,777,875 $MKR
$68,641,621 $BIT
$63,224,815 $UNI
$47,399,457 $LINK
$40,428,062 $MATIC
$38,107,788 $MANAWhale leaderboard 👇https://t.co/jFn1zIOq03 pic.twitter.com/rZBY25kYHR
— WhaleStats (tracking crypto whales) (@WhaleStats) November 1, 2022
Even with these updates, UNI investors might have a few reasons to worry, as not everything suggested a further price surge. UNI had already registered negative 24-hour growth, which may cause some concerns. Additionally, at press time, UNI was trading at $6.96 with a market capitalization of more than $5.3 billion.
Alarms are raised
CryptoQuant’s data revealed that UNI exchange reserves were rising, which was a bearish signal. It indicated higher selling pressure. Moreover, UNI‘s transaction volume and number of transactions registered a decline over 1 November. This increased the chances of a price decline in the days to come.
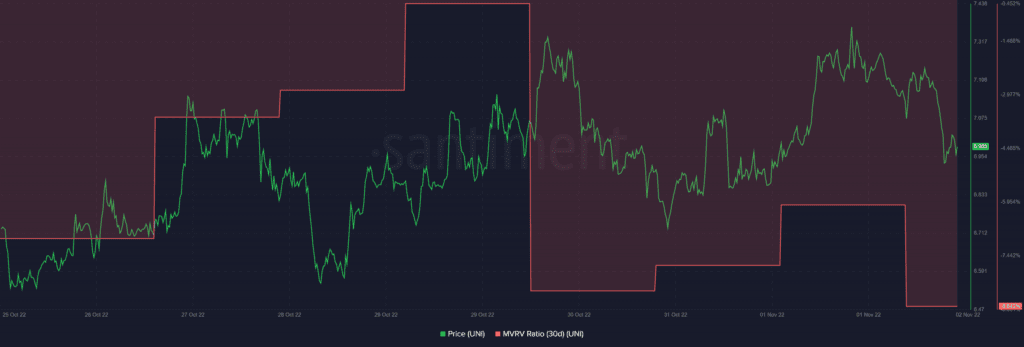
Furthermore, according to Santiment, UNI’s Market Value to Realized Value (MVRV) Ratio also went down, which was yet another red flag for Uniswap.
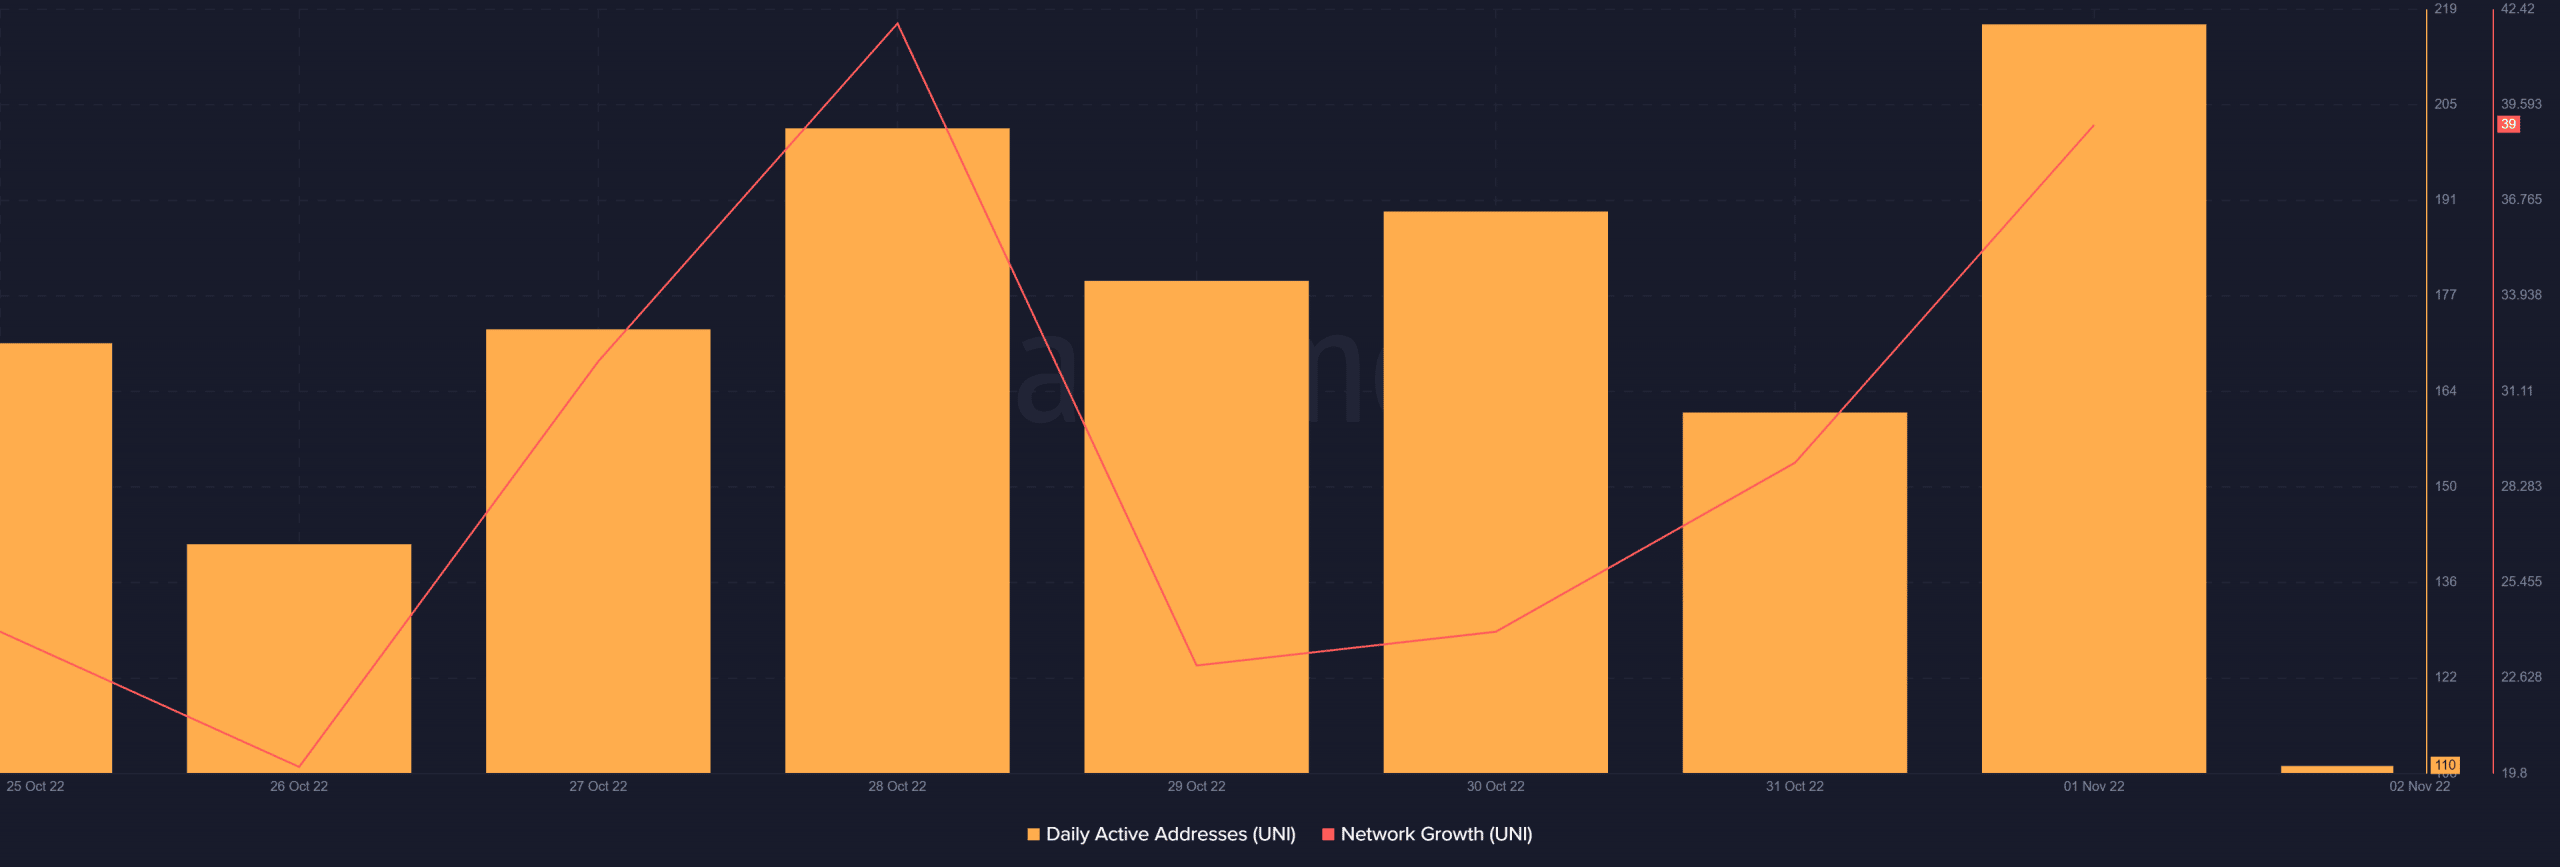
Nonetheless, investors still might have a chase to enjoy UNI’s uptrend, as a few metrics were supportive of that outcome. For instance, UNI’s daily active addresses went up over the last week, thus indicating a higher number of users present on the network. Additionally, UNI’s network growth also registered an uptick, which was a positive signal.
Onwards and upwards you say? Too soon I say…
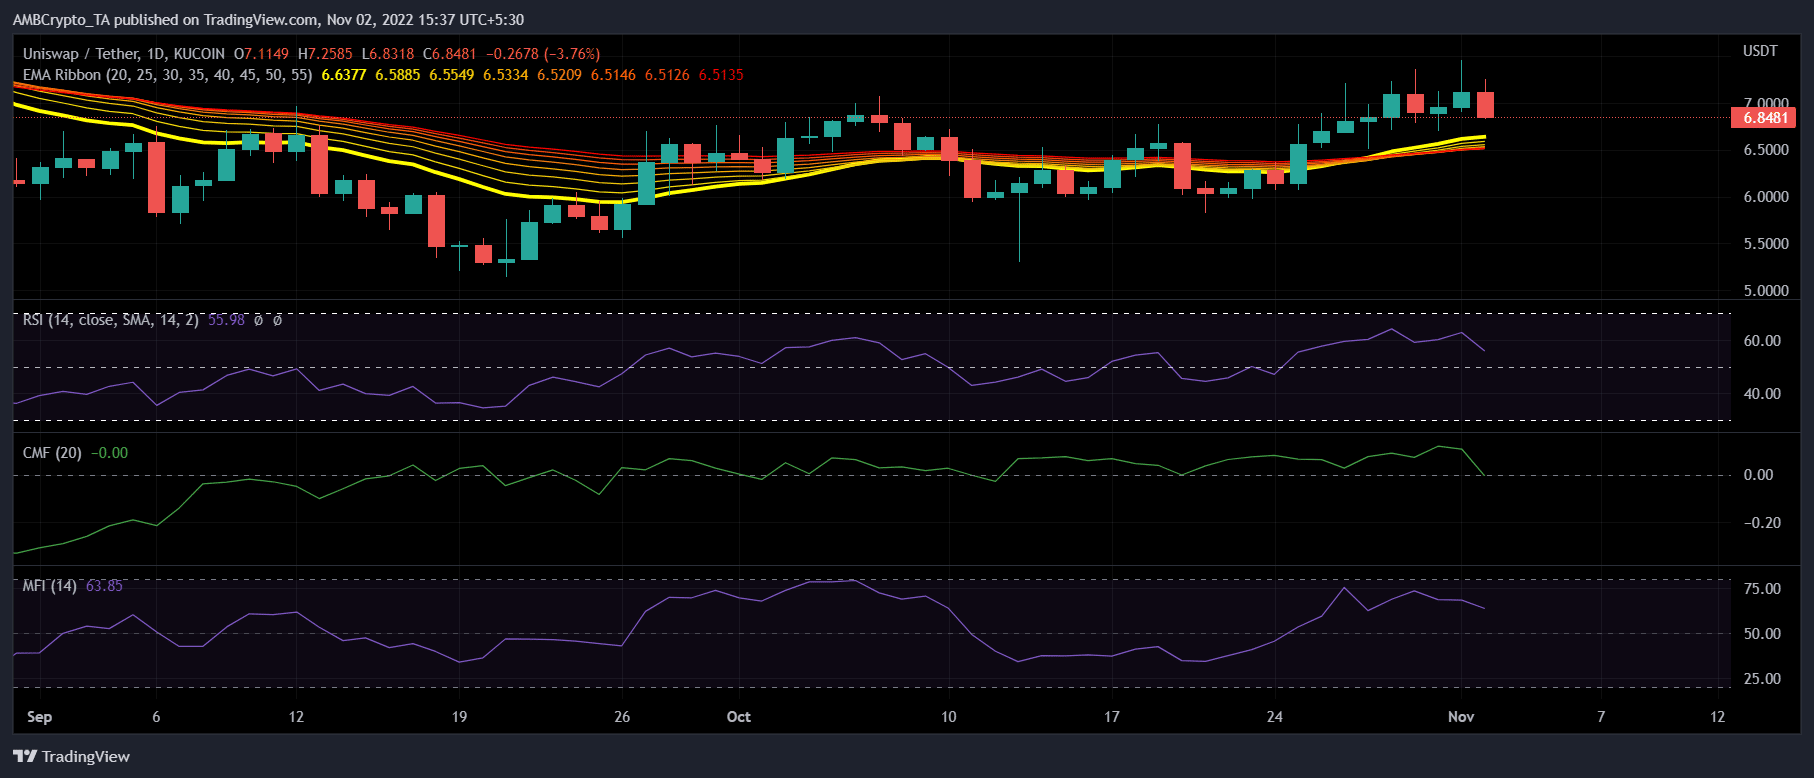
UNI’s daily chart also revealed a somewhat bearish picture, as most market indicators suggested a sellers’ edge in the market. The Relative Strength Index (RSI) and Chaikin Money Flow (CMF) both registered downticks, further establishing a bear advantage.
The Money Flow Index (MFI) also took the same route and went down towards the neutral mark. However, the Exponential Moving Average (EMA) Ribbon displayed a bullish crossover as the 20-day EMA flipped the 55-day EMA, which gave investors’ hope for better days ahead.


