Disclaimer: The findings of the following analysis are the sole opinions of the writer and should not be considered investment advice
Uniswap was on a relentless downtrend as the bears sought to drive prices below $8.22, and a lack of demand was evident. The bearish trend hinged on two levels at press time. Even though the exchange is one of the largest decentralized exchanges, its token has had a rough time on the charts in recent months.
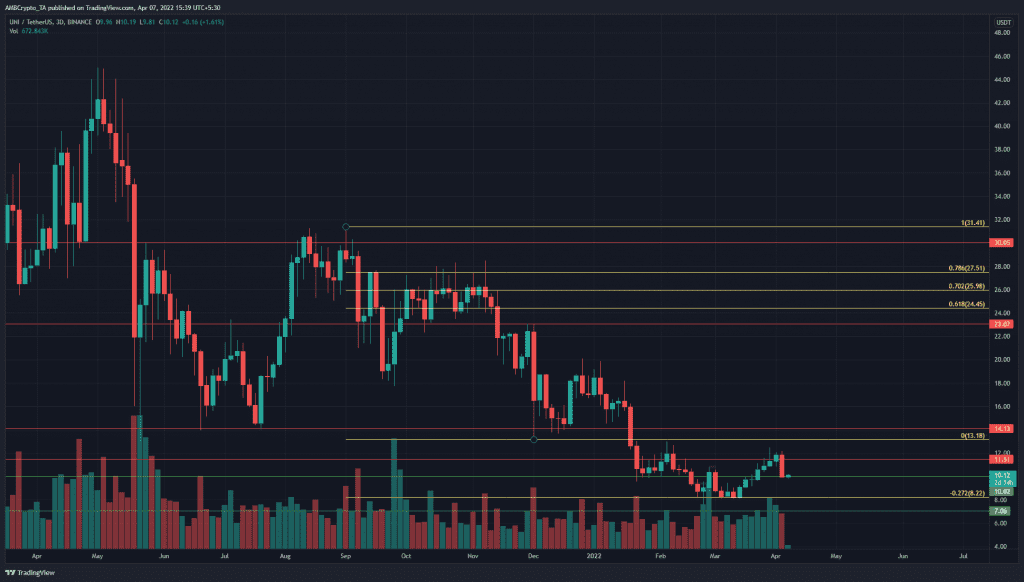
UNI- 3 day chart
The 3-day chart was employed to understand the severity of the downtrend that UNI has been on. The coin formed a high at $45 in May but has not been able to post a higher high since. Moreover, following the rally in August, the price of the token began to slump on the charts once more. The $30 level refused to be breached.
In the past few months, the price has continued to register a series of lower highs and lower lows, characteristic of a downtrend.
The Fibonacci extension levels (yellow) were plotted based on UNI’s move from $31.41 down to $13.18 and gave a 27.2% extension of this move southward at $8.22. Incidentally, $8.2 has been a place where some demand was seen in the past month.
That said, the bounce was unable to climb past $13 and the market structure continued to be bearish.
Rationale
The 3-day RSI has been below the neutral 50 line since late October. It tried to poke its nose back above but was unable to as the price was rejected at $12.49. The Chaikin Money Flow was also below the -0.05 mark to denote strong selling pressure.
The OBV saw a sharp bounce in the past month, but even the OBV has been on a downtrend for nearly a year.
Conclusion
For the bulls, a move past $13 would be necessary for Uniswap to break the bearish market structure. On the other hand, the bears will be looking to drive the price back below the psychological $10 level, and push it beneath $8.2 as well.


