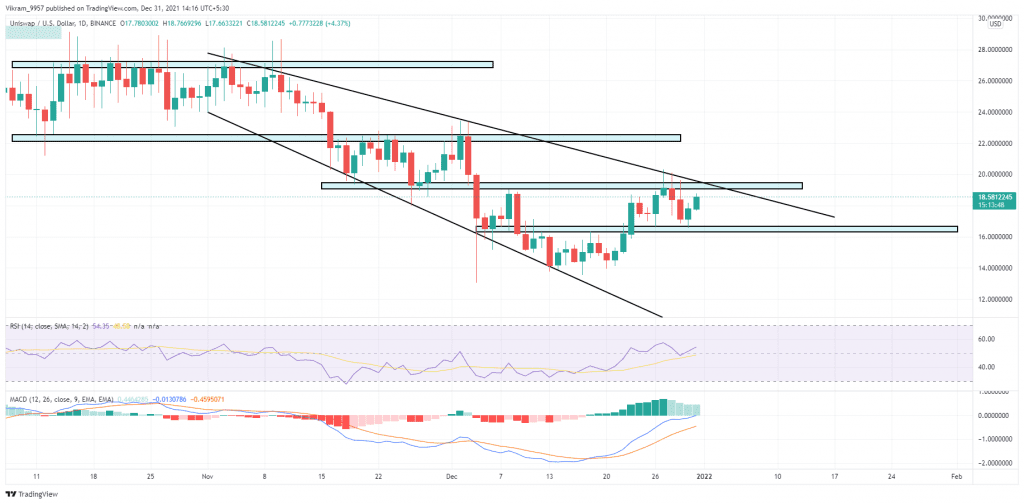
The Uniswap coin price forms a bullish pattern in the daily chart that can result in an upside breakout shortly. Therefore, traders need to stay sharp and patiently wait for a breakout entry opportunity. The bull run following the breakout can drive the prices higher to the $27 mark.
Key technical points
- The UNI token shows possible golden crossover in the 4-hour chart
- The intraday trading volume in the UNI token is $324 Million, indicating a 30% fall.
Source- Tradingview
In our previous Uniswap coverage on December 15th, the UNI token found support near the $14 support zone leading to a bullish reversal. However, the reversal failed to rise above the $20 resistance zone, pushing the price back to $16.
Nonetheless, the UNI coin price action forms an extremely bullish pattern that can result in a rally of more than 60%. The breakout descending broadening pattern in the daily chart will release the trapped bullish momentum and drive the prices higher to $27.
As per the crucial EMAs level, the UNI token trades above the 50 and 200 EMA in the 4-hour chart. Moreover, the EMAs tease the possibility of a golden crossover.
The Relative strength index(54) showed an instant recovery from the 50% mark. Moreover, the slope shows bullish divergence in the daily chart.
UNI Token Struggles Near The $20 Resistance Zone

Source- Tradingview
The Uniswap token is currently at the doorstep of $20 resistance and the resistance trend. If the price fails to rise above the supply area near the confluence then a reversal to the support level is plausible.
However, the release of trapped bullish sentiments looks imminent and can result in the breakout of the resistance trendline.
The price action suggests the overhead resistance levels for the token are $22.5, followed by $27. Whereas on the flip side, the support levels are at $16 and $13.


