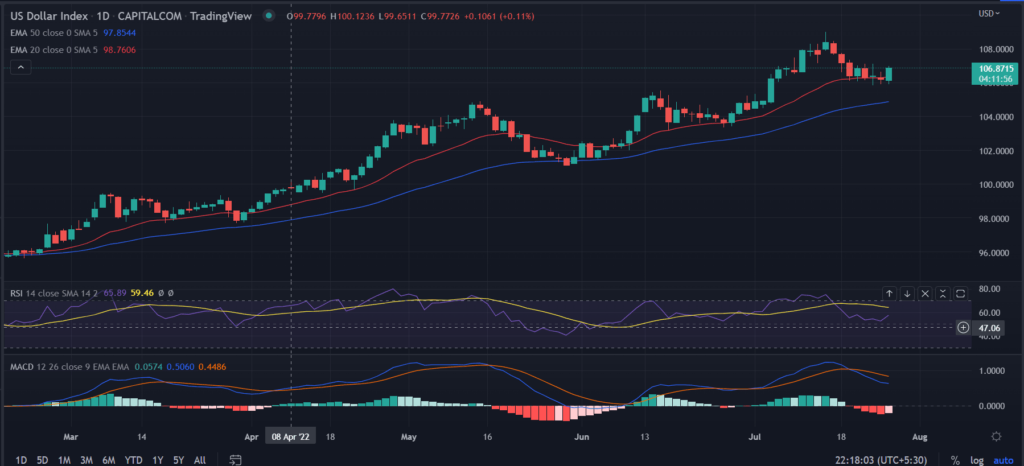
The U.S dollar index is living up to its reputation as the “king’ of the market lately. Despite a shallow pullback in the previous week, the US dollar stays grounded near the $106.0 mark. The risk-averse market fuels the rally in the safe haven. Global recession fears and inflationary concerns kept investors on their toes.
advertisement
A high-value dollar kept the pressure on all other financial assets beyond the crypto market. The index touched its 20-year high in the previous week at 109.29. Currently, BTC/USD fell more than 4%, ETH/USD lost 9%.
As of writing, DXY reads at 106.97 up 0.57% so far.
Further, the International Monetary Fund (IMF) in its recent assessment cut its global growth outlook to 3.2% in 2022 from 3.6% in the April projection. This, added to the appreciation of the greenback due to its stability.
Trending Stories
New home sales in the US fell 8.1% from a month earlier in June 2022 to 590,000, well below the market consensus of 660,000. The weaker economic data could force Fed to adopt a more aggressive stance on interest rates.
The benchmark US Treasury yield fell more than 2% on Tuesday at 2.72 ahead of a key Fed policy decision. The market is gearing up for a 75bps rate hike in a two-day policy meeting, which begins on Tuesday, which would add to the attractiveness of the greenback.
DXY maintains upside momentum
On the daily chart, the US Dollar Index (DXY) registered an impressive single-day gain near 107.00. The formation of a strong green candlestick indicates the underlying bullish sentiment. The price comfortably sits above the critical 50-day exponential moving average (EMA) at 104.85.
Now, the greenback found additional support and much-needed buying support at the shorter moving average too. The price holds above the 20-day moving average at 106.32.
An acceptance above Friday’s high of 107.09 would accelerate the upside momentum toward 108.0 in the short term.
RSI: The RSI (14) oscillates near 50 and attempts to move above the average line.
advertisement
MACD: The momentum indicator stays above the mid-line but with decreasing upside momentum.


