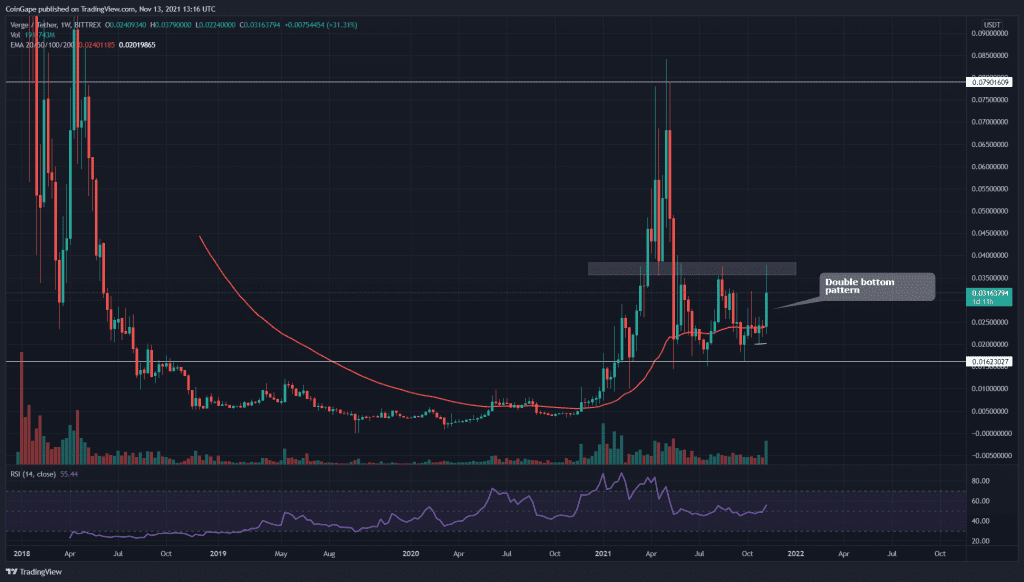
The XVG/USD chart showed a decent rally last week, where its high indicated a 74% from the month’s low. However, the overall trend for this coin is still bearish and currently facing a crucial resistance, can we expect a bearish reversal?
Key technical points:
- The XVG coin forms a double bottom pattern in the weekly time frame chart
- The weekly chart’s RSI shows have jumped above the neutral(50) line
- The intraday trading volume in the XVG coin is $102.1 Million, indicating a 23% fall.
Source- XVG/USD chart by Tradingview
The XVG coin weekly chart revealed a great long opportunity for crypto traders by a double bottom pattern. The pattern has its neckline at the $0.038 mark, and today the coin price retested this resistance level only to face strong rejection from it.
The crypto traders should wait for a proper breakout from this overhead resistance, that would trigger an entry signal for a long trade. As per the crucial EMAs(20, 50, 100, and 200), the coin is under bullish trend as its price is trading above these lines.
Furthermore, The Relative Strength Index line has recently crossed above the neutral line, projecting a bullish sentiment for the coin.
XVG/USD Chart In The daily Time Frame

Source- XVG/USD chart by Tradingview
As mentioned above, the XVG coin price was rejected from the crucial resistance of the $0.038 mark. The coin price is currently trading at the $0.031 mark, projecting a 10% loss in its intraday session.
If the market bears managed to break down from the minor support level of $0.031, the coin should have a clear road to the 200-day EMA.
As per the traditional pivot levels, the nearest resistance for this token would be at $0.038, followed by $0.043. As on the flip side, the support levels are $0.031 and later $0.052.


