With Bitcoin (BTC) down 72% from its all-time high, the global cryptocurrency market seemed to be a shambles throughout the third quarter; however, long-term indicators pointed towards a maturing market.
As the third quarter of 2022 approaches an end, on-chain analytics for the top cryptocurrency by market capitalization presented a dispiriting picture. Bitcoin’s flag has often soared high in the rather volatile space owing to its store of value and inflation hedge narrative.
BTC’s close of 50% gains in the third quarter of 2021 had attracted investors and traders to the network like bees to honey. However, the same cannot be said for the third quarter of this year.
A recent Messari report highlighted how the latest market crash was a “narrative breaker and reality check” for Bitcoin.
Bitcoin’s inflation hedge narrative dead?
At the time of writing, Bitcoin’s return on investment (ROI) vs USD over the last three-months was -10%, while its yearly ROI vs USD was 53.38%. The low short-term and long-term ROIs presented that both short-term and long-term BTC HODLers were suffering a net loss.
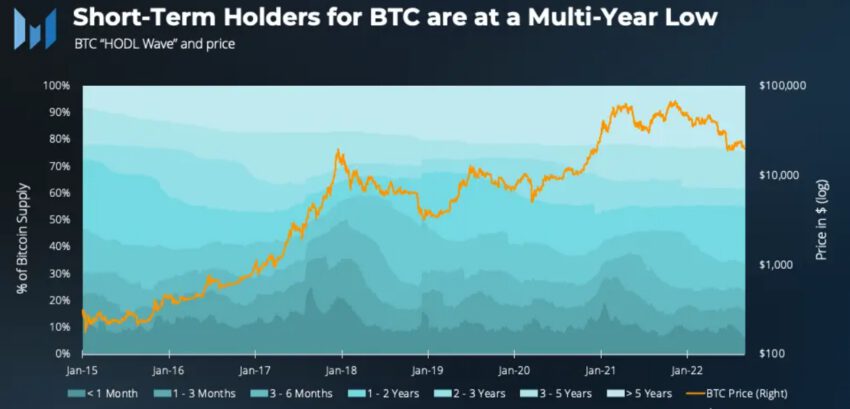
BTC HODL wave and price chart shows that short-term holders (under six months) were at a multi-year low and owned a mere 23% of the Bitcoin supply, as of Aug. 31.
A rise in short-term holders is typically considered a macro-bullish signal and usually happens around price gains. However, it was notable that BTC’s Nov. 2021 ATH did not attract as many new investors most likely due to macro environmental factors.
Additionally, BTC’s negative returns and range-bound price momentum under the $30,000 mark since June negated its inflation hedge and store of value narrative.
For many in the market, BTC’s negative returns mean that its inflation hedge narrative is dead, while for others like MicroStrategy’s Michael Saylor, Bitcoin’s low prices are just another opportunity to buy the dip.
Losing network vibrancy
After making an all-time high of $69,000, BTC’s price saw an over 70% pullback amid the risk-off macro environment.
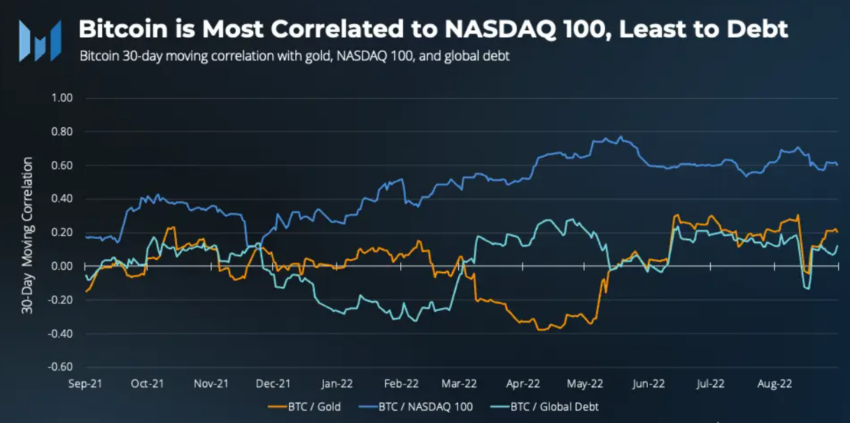
A comparison of BTC and Nasdaq 100 revealed that Bitcoin’s price has been similar to that of a high-beta U.S. tech equity, thus negating its store of value narrative.

During this quarter, the average correlation between BTC and Nasdaq 100 was 0.6 as inflation and rate hikes dominated the narrative, while BTC was least correlated to debt. Interestingly, however, digital gold (BTC) and physical gold were way less correlated with an average correlation of 0.2.
In addition to this, BTC’s funded addresses and active addresses saw a rather slowed growth through third quarter. Funded addresses only grew by 1.1% compared to 2.5% in second quarter 2022, while average daily active addresses were down 4% compared to second quarter 2022.
Any hope ahead?
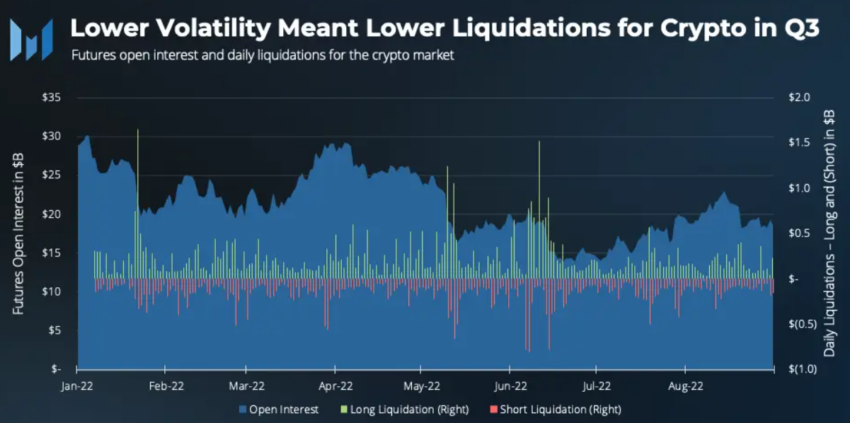
Despite the negative returns and BTC almost losing its inflation hedge narrative the coin’s realized volatility trended downwards as the price made a gradual recovery in the third quarter. Lower volatility for the top asset resulted in lower liquidations for the larger crypto market.

The average 30-day volatility in Aug. was 60% compared to over 80% for June. In contrast, total long liquidations in Aug. were $5 billion, less than half of that in June while short liquidations were significantly lower as well.
All in all while volatility was low for BTC throughout the third quarter, the asset has yet to “mature” to a lower risk spectrum. That said, BTC’s weakening bullish narratives have taken a toll on the larger crypto market too with sentiment tilting more on the bearish side for digital assets.
Disclaimer
All the information contained on our website is published in good faith and for general information purposes only. Any action the reader takes upon the information found on our website is strictly at their own risk.


