Watch This Episode On YouTube Or Rumble
Listen To The Episode Here:
“Fed Watch” is a macro podcast with a true and rebellious Bitcoin nature. Each episode, we question mainstream and Bitcoin narratives by examining current events in macro from across the globe with an emphasis on central banks and currencies.
In this episode, I’m joined by Q and Chris Alaimo of the Bitcoin Magazine livestream crew to talk about the “recession” versus “not a recession” versus “depression” debate. I also dive into understanding the temporary effects of fiscal spending by governments and the brick wall facing the global economy, demonstrated through yield curves. We finish up with a Q and Ansel (question and answer) from the guys and community.
You can find the slide deck for this episode here.
Recession Debate
In recent days, many people have started to notice the National Bureau of Economic Research (NBER) has changed the definition of what constitutes a recession. Outrage at the blatant sleight of hand has come to a fever pitch. Common sentiment is, “How dare they change the definition to save the reputation of an unpopular president?”
Few people realize that the definition had already changed back in 2020 with the COVID-19 recession. It was the shortest recession on record, only lasting from March to April 2020. The definition changed to be more subjective in order to narrow what a recession is and to place one on the previous president’s record. Now, this more subjective measure is being used to broaden the definition to keep a recession off this president’s record.
Once again, the danger of letting political interests control supposedly neutral data and science is plainly obvious.
Leading us into a discussion about the U.S. consumer and the weak state of the economy, I read from a Walmart financial release, which is important because they are the largest retailer in the world by a long margin.
“Operating income for the second-quarter and full-year is expected to decline 13 to 14% and 11 to 13%, respectively.”
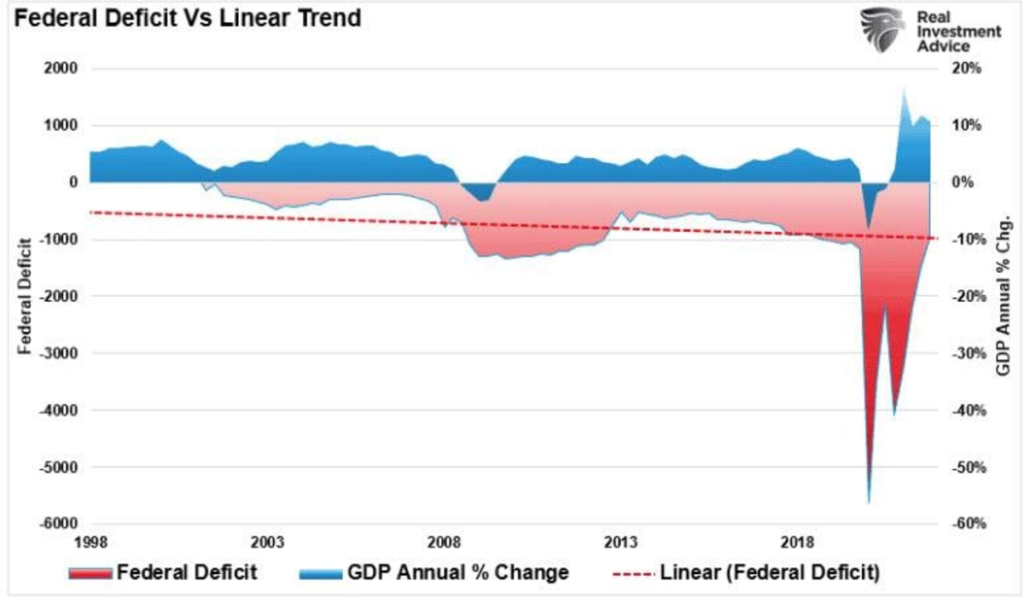
Lance Roberts put together some excellent charts to refute the apparatchiks’ new party line: that there is no recession. First is deficit spending. On the podcast, I used this chart to show how fiscal spending is not money printing, it simply pulls demand forward. If it is not sustained, there is a gaping hole of demand coming behind it.
(Source)
We can see the economy racing toward this gaping hole in the yield curves. The first chart below goes all the way back to the 1981-1982 recession, showing many selected yield curves. Notice the steady cascade toward inversion (negative on the chart) that usually characterizes the march into recession. However, this chart shows an almost immediate dive into inversion as if hitting a brick wall.
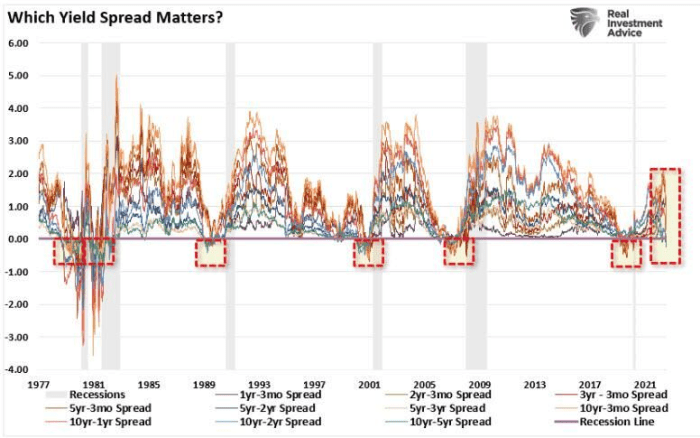
(Source)
Below is a zoomed-in chart that we looked at on the podcast. I selected a few yield curves for the 10-year and five-year Treasurys. Again, the abrupt nature of the current crash is like hitting a brick wall.
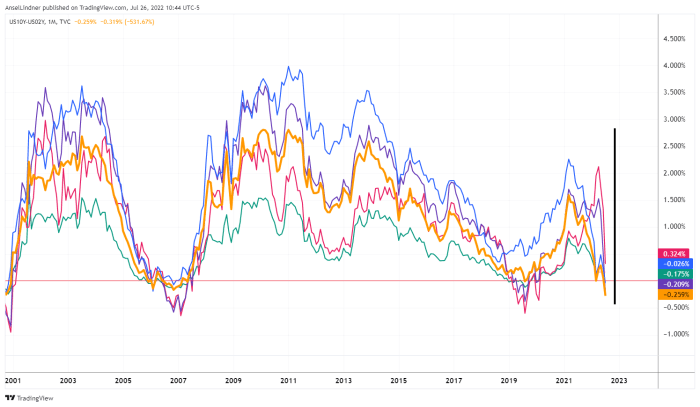
(Source)
At this point in the podcast, I felt like I was being a little bit alarmist, and I did just write a blog post condemning the “fear hustlers and alarmist pimps,” so I used the following chart from Jeff Snider, in which he shows we haven’t returned back to previous growth trends and possible outcomes of this recession. I expect the outcome of this recession in the U.S. to be generally light, similar to the dot-com-type recession.
Behind all this controversy about the word “recession,” we are left with the realization that it doesn’t matter anyway. We are going to have a slight downturn and return to the post-Global Financial Crisis normal of low growth and low inflation.
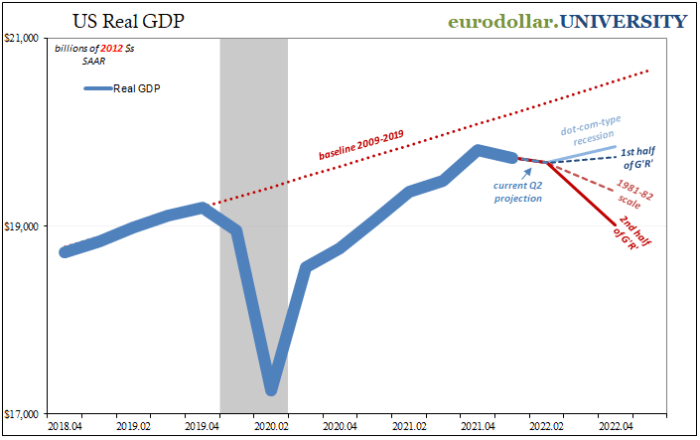
(Source)
Bitcoin, The Dollar And Rate Hikes
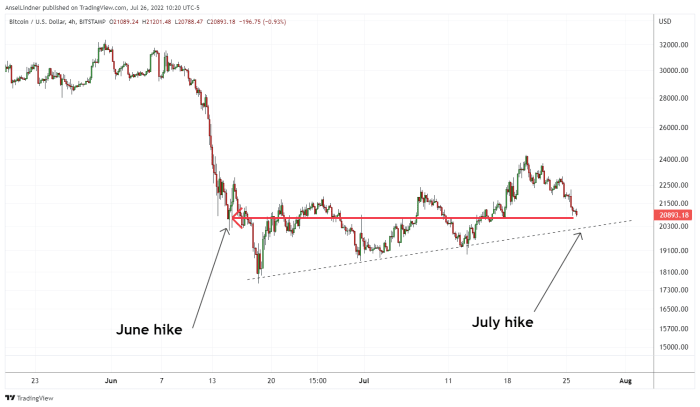
Next, we talk about bitcoin and rate hikes. I think it is very interesting that, at the June 2022 Federal Open Market Committee (FOMC) policy announcement of a hike of 75 basis points, bitcoin is at very nearly the same level as today.
To be exact, at 2 p.m. ET on June 15, 2022, the bitcoin price was $21,505. As I wrote this at 11 a.m. ET on July 27, 2022, the price was $21,440. Very interesting that despite the negative news around Bitcoin, and the hawkishness from the Federal Reserve, the bitcoin price remains extremely strong.
(Source)
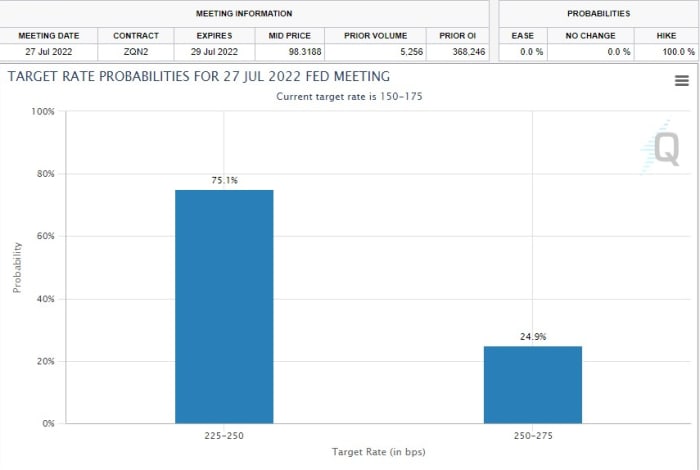
The last image for this week was the Chicago Mercantile Exchange’s FedWatch Tool (which took our podcast’s name!). At the time of recording, it was showing a 75% chance of a 75 bps hike and a 25% chance of a 100 bps hike.
(Source)
That does it for this week. Thanks to the readers and listeners. Don’t forget to check out the Fed Watch Clips channel on YouTube. If you enjoy this content, please subscribe, review and share!
This is a guest post by Ansel Lindner. Opinions expressed are entirely their own and do not necessarily reflect those of BTC Inc. or Bitcoin Magazine.

