Even though the technical chart indicated heavy bear attacks on Metacoins during the recent correction phase. The fundamental development of the Metaverse ecosystem has significantly upscaled as more renowned companies and industry giants like Meta(previously known as Facebook), Apple, and now Disney entering the metaverse. Furthermore, the Bitcoin price reclaims the $40000 milestone has positively impacted the market sentiment, eventually soaring the altcoins.
MANA Buyers Aims To Reclaim $3 Mark
Source-Tradingview
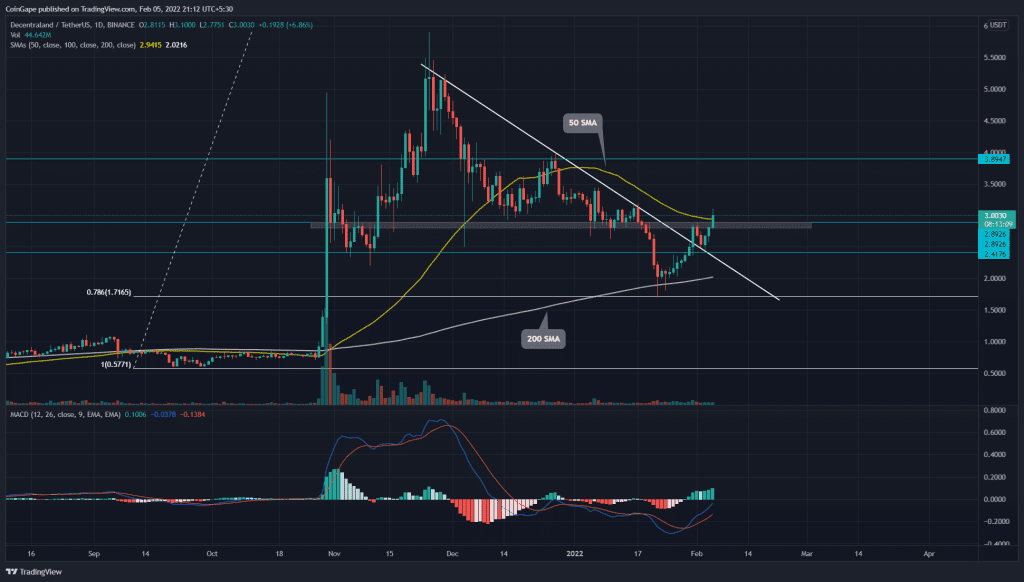
Under the influence of the descending trendline, the MANA price plunged to the 0.786 Fibonacci retracement level($1.71), indicating a 70% loss from the All-Time High resistance of $5.9. However, the coin price showed a remarkable 77% recovery during the last two weeks, which pierced the dynamic resistance trendline.
The bulls have breached a crucial shared resistance of $2.9 and 50-day SMA, indicating the buyers are ready to initiate a recovery rally. If the coin provides a daily candle closing above this resistance, the buyers would drive the alt to $3.43 or $3.9.
Contrary to the assumption, if buyers fail to sustain the coin above the $3 mark, the alt price would sink to $2.4, followed by $2
Anyhow, the moving average convergence/divergence indicator shows the MACD and signal line are steadily approaching the midline from below. This bullish crossover would provide an excellent confirmation to long traders.
GALA Teases A Bullish Breakout From The Consolidation Phase

Source- Tradingview
For the past two weeks, the GALA buyers were defending the $0.17 mark with vigor. However, the intense selling pressure at $0.23 resulted in forming a narrow range. Such consolation provides a strong directional move as the price breakout from either of its levels.
Today, the token shows a massive bullish candle piercing the combined resistance of $0.23 and descending trendline, indicating a possibility of bullish reversal. The GALA price gained 42% from the $0.17 support; however, the crypto traders should wait for a daily-candle closing above this resistance to confirm this breakout.
If buyers sustain above the $0.23 mark, the alt would rally to the immediate resistance of $0.288 followed by 0.36
However, the downsloping 50-day MA drops below the 100 MA line. This bearish crossover encourages the sellers to continue the bear attack.
Double Bottom Breakout Pushes AXS Higher

Source- Tradingview
After finding supply near the $160 mark, the AXS token price starts a correction phase within a falling channel pattern visible in the daily chart. The downfall breaks multiple support levels before finding demand near the $50 support zone.
The AXS token price action forms a double bottom pattern near the $50 support zone that may shortly challenge the resistance trendline of the falling channel. Moreover, the 20-day EMA provides dynamic resistance to bullish attempts.
From a technical perspective, the RSI indicator shows a spike in the underlying bullishness as the slope breaks and escapes the oversold zone. The slope breaks above the 14-day SMA and shows the presence of a bullish divergence in the double bottom pattern.
The post-breakout uptrend can find resistance near the trendline of the falling channel and the $85 mark. However, In the case of a bearish reversal, the support levels are present at $50 and $32.


