Disclaimer: The findings of the following analysis are the sole opinions of the writer and should not be considered investment advice
Bitcoin saw a sharp pullback of around 6% from the supply zone at $48k to trade at $44.6k at the time of writing. Bitcoin Cash followed suit and posted a drop of 4.5% the previous day. However, the market structure of BCH in the near term looked encouraging for the bulls.
BCH- 4H
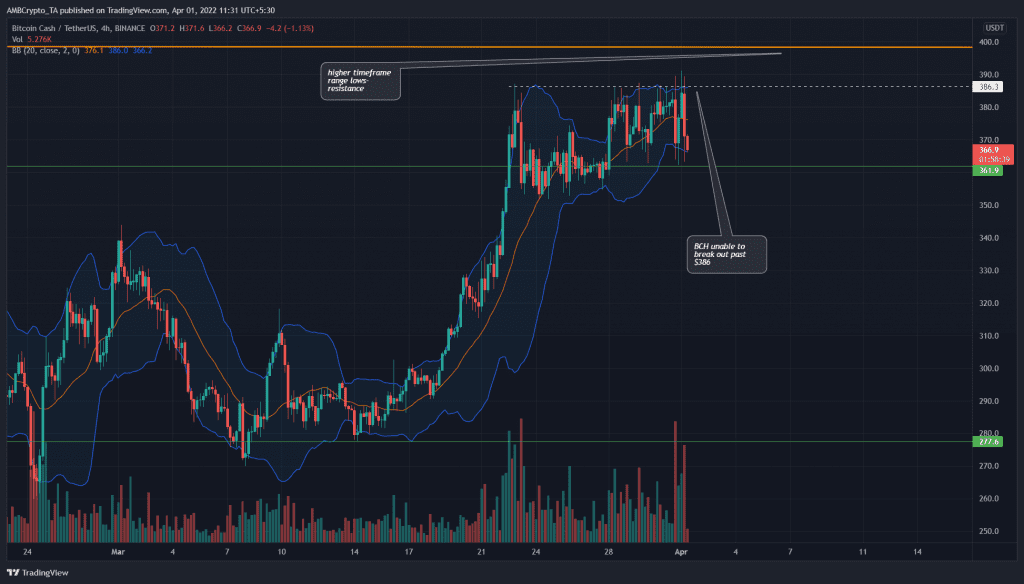
In the past week, BCH has ranged from $355 to $386. Earlier this month, the price saw a strong rally from the $277 support level. Hence, this range formation after a strong move can be seen as consolidation before the next major move for BCH.
The Bollinger bands were relatively wide as the price bounced between the $386 resistance and $361 support level. Even though the price has been unable to register a higher high, the previous swing low at $353.3 has not yet been violated.
Hence, the $355-$360 could be a buying opportunity, targeting $386 and $400.
A session close below $353 would shift this bias, however, and in the near term a move to $340 could materialize.
Rationale
On the 4-hour chart, the RSI dropped below neutral 50 but not by a large margin. It stood at 44.7 and has been falling in the past week to signal the slowdown of bullish momentum.
On the other hand, the OBV has been steadily climbing in March. This northward march was a sign of buying volume being higher than the selling volume consistently over the past three weeks.
Conclusion
On the larger timeframes, the market structure for Bitcoin was bullish. Even though a pullback as deep as $42k and $40k could be witnessed, the price was likely to head back higher once more in search of liquidity. As things stood at press time, BTC was in an area of demand and a bounce could be likely.
Bitcoin Cash could follow in Bitcoin’s footsteps and make further gains in the days to come, and possibly even beat the $400 resistance zone.


