The prolonged bear market is putting even the most ardent holders to the test. Many are supported by regular doses of hopium that comes from on-chain analysis. However, it appears that perhaps Bitcoin has not bottomed yet.
That’s according to Willy Woo, one of the most respected on-chain analysts in the crypto space. To substantiate his claim, he published a series of tweets today. Here we find 3 indicators according to which Bitcoin has not yet reached the bottom.
Has one of Bitcoin’s biggest supporters suddenly gone bearish? Or have we all looked at on-chain analysis too optimistically, and Willy Woo is just trying to bring back the lost balance?
Bitcoin has already bottomed out – has it?
In regular on-chain analyses provided by BeInCrypto, we have repeatedly pointed to indicators according to which Bitcoin has already reached – or is very close to reaching – the macro bottom of the ongoing bear market. In last week’s analysis, we described 4 on-chain indicators that, according to historical data, seem to confirm that the bottom has been reached.
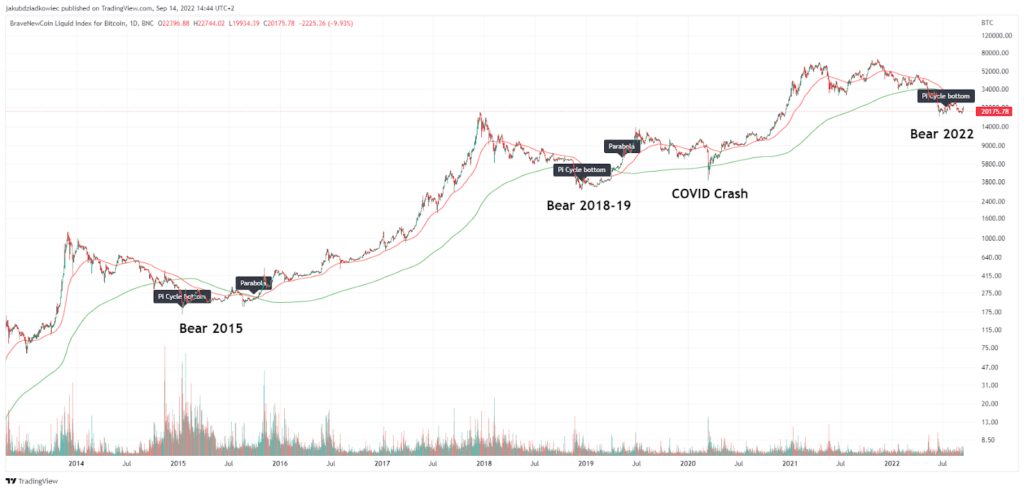
Among these indicators, we find Hash Ribbons, Dormancy Flow, Puell Multiple or Realized Losses. In addition, the MVRV Z-score has recently been at historical lows. Even a relatively new indicator called Pi Cycle Bottom supports the narrative that BTC’s macro bottom has already been in place.
Willy Woo: Have we bottomed?
In spite of this data and growing layers of hopium, one of the most well-known and respected on-chain analysts, Willy Woo published a series of tweets today. He began each of them with the question “Have we bottomed?” And it seems that the content of each of them answers – no!
The first indicator Willy Woo points out is Cost Basis. There he compares the cost basis of buying BTC for short- and long-term holders. It turns out that the lows of the historical bear markets of 2015 and 2019 occurred only when short-term holders achieved a lower cost basis than long-term holders.
Woo adds that this is exactly what happened in 2019. However, in 2015 the final capitulation of BTC took place in this area (red).
Currently, on the cost basis chart, the red line of short-term holders has not yet intersected with the blue line, which represents long-term holders. Once this happens, Bitcoin could reach a final capitulation and reach a macro bottom below the current level of $17,622.
Bear market accumulation
The second indicator used by Willy Woo is Bear Market Accumulation. The analyst quantitatively defines accumulation as “coins moving away from sellers to urgent buyers.”
In the chart he presents, we notice the current accumulation period (right) and 3 historical periods. Each corresponds to a rising graph (red, dashed), which represents the size of each bear market accumulation.
Willy Woo then draws identically sized arrows (black), whose purpose is to compare the size and duration of the accumulation periods. In this illustrative way, it turns out that the current accumulation has reached slightly more than half the level of all previous accumulation periods. What’s more, the macro lows on the Bitcoin chart appeared only after the accumulation peak was reached.
Cost Basis Density Map
The last indicator to suggest that the bottom has not yet been reached is the Cost Basis Density Map. This chart is accompanied by a blue line representing the percentage of coins experiencing a loss. In other words, their purchase costs were higher than the current BTC price.
Willy Woo claims that currently “the market has not felt the same pain as prior bottoms.” He points out that today only 52% of coins are underwater. In contrast, during the macro lows of previous bear markets, it was 61%, 64%, and 57%.
In a comment on his own tweet, he claims: “History doesn’t need to repeat, especially in the modern era with futures hedging available that is not picked up on-chain.” He further adds that if we were to reach 60% of the coins in loss today, the price of Bitcoin would be at $9,100.
For Be[in]Crypto’s latest Bitcoin (BTC) analysis, click here.
Disclaimer
All the information contained on our website is published in good faith and for general information purposes only. Any action the reader takes upon the information found on our website is strictly at their own risk.


