Disclaimer: The information presented does not constitute financial, investment, trading, or other types of advice and is solely the writer’s opinion.
- A chart pattern for Stellar shows a drop to $0.1 could commence soon
- Market structure and momentum have also been in favor of the sellers recently
Stellar saw an abrupt rejection at the $0.13 resistance level and has shed 15% of its value since then. The formation of a bearish chart pattern, combined with the higher timeframe market structure, suggested more losses could follow.
Here’s AMBCrypto’s Price Prediction for Stellar [XLM] in 2022-23
Short traders can look for a breakout beneath this pattern to further solidify their conviction. A retest of the short-term support level, in the event of a southward move, can be used to sell XLM.
Range formation and triangle pattern suggest XLM could head toward $0.1 again
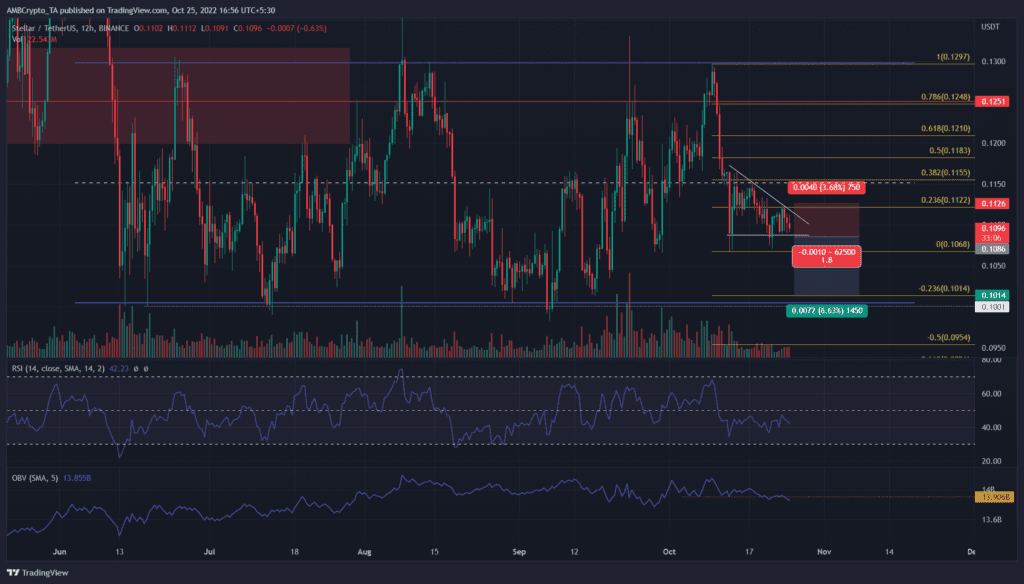
Marked in blue was a range that Stellar has traded within since mid-June. It extended from $0.13 to $0.1. In the past two months, Stellar has rallied from the range lows to the highs. At the time of writing, it was in the midst of another move downward.
Just over two weeks ago, a retest of the range highs saw XLM face a stiff rejection. It was unable to hold on to the short-term support level at $0.125 and plummeted 12% in two days.
The past two weeks saw XLM form a descending triangle pattern (white). Some support was seen at $0.108. Owing to the bearish momentum in recent weeks, it was quite likely that this pattern would see a move downward.
The RSI has stayed below neutral 50 to add credibility to this idea. However, it did not reach overbought nor oversold territory in recent months, which showed the range formation. The OBV also fell beneath a support level from earlier this month.
The Fibonacci retracement levels (yellow) showed that a move above $0.112 could invalidate the bearish idea laid out above. Meanwhile, the 23.6% extension level at $0.101 was close to the range lows and can be used to take profit.
A move below the $0.125 mark and its subsequent retest can be used to enter a short position.
Flat OI within the pattern and negative funding rate show seller strength
![XLM is poised for another leg downward, but buyers can benefit here 2 Stellar [XLM] poised for another leg downward after bearish chart pattern develops](https://statics.ambcrypto.com/wp-content/uploads/2022/10/PP-3-XLM-santiment.png)
Source: Santiment
The funding rate had been negative after the first week of October. This corresponded with XLM’s drop from the range highs at $0.13. The previously positive funding rate saw a rapid decline into negative territory.
At press time, the funding rate showed that short positions paid longs and that futures market participants remained bearish.
Development activity has been good in recent months, although the past two weeks did not see heavy activity.
![XLM is poised for another leg downward, but buyers can benefit here 3 Stellar [XLM] poised for another leg downward after bearish chart pattern develops](https://statics.ambcrypto.com/wp-content/uploads/2022/10/PP-3-XLM-OI.png)
Source: Coinglass
The Open Interest has been rather flat over the past two weeks. During this same period, XLM formed the descending triangle pattern on the charts. In the event of a breakout to either side (likely lower), a rise in the OI can indicate conviction in the direction of the move.


