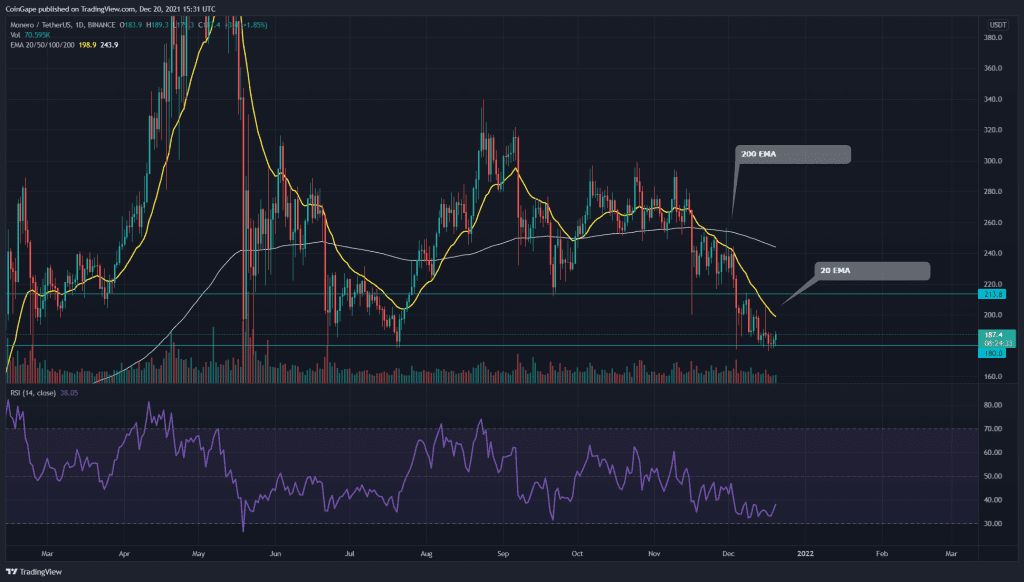
The XMR/USD technical chart projects an overall sideways trend for this coin. The price resonates in a falling parallel channel pattern for its recent down rally. Though the pattern follows a downtrend, it also poses a possibility of initiating a bull rally.
XMR/USD Daily Time Frame Chart
Source- Tradingview
Past Performance or Trend-
Since the crypto bloodbath of May ‘21, the XMR token has followed a sideways trend. The price action has been confined between the $340 and $180 mark for the last six months. After its latest rejection from the psychological level of $300, the price plunged back to the $180 support.
Bullish RSI Divergence Hints An Upcoming Rally In XMR Coin
For this short-term downtrend, the XMR coin has been resonating in a falling parallel channel. The pattern has led this red rally since the $300 mark and has brought it to the $180 crucial support. The coin will follow a downwards rally until this pattern is intact and potentially breach this bottom support.
On a contrary note, this type of pattern is quite known for a strong bullish rally when the price gives a proper breakout from the overhead resistance trendline. Therefore the crypto trader should keep a sharp on this pattern as it provides early signal and entry opportunity for a long trade.
By the time of writing this article, the XMR coin price is $187.2, with an intraday gain of 1.79%. The 24hr volume change is $166.7 Million, indicating a 60% hike. As per the coinmarketcap, the coins stand at 44th rank with its current market cap of $3,370,104,416(+2.03).
XMR/USD 4-hour Time Frame Chart

Source-Tradingview
Technical Indicators-
-The daily Relative Strength Index(38) indicates a bearish sentiment for the token. However, the RSI has started projecting some positive signs in its chart.
-The XMR coin indicates a bearish alignment of the crucial EMAs(20, 50, 100, and 200). Moreover, the 20 EMA line provides dynamic resistance to the coin price.
-according to the pivot levels, coin traders could expect the closest resistance to the XMR price to be $189 then $200. For the reverse, the support levels are $172 and $159.6.


