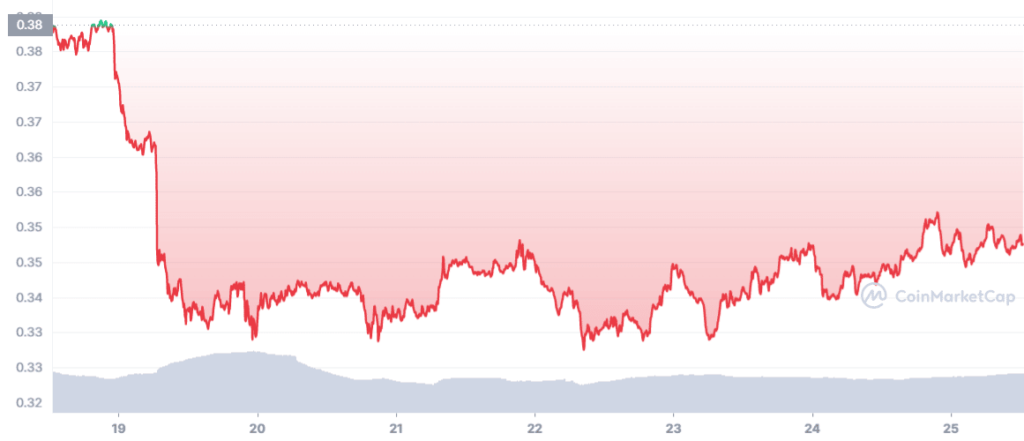
XRP’s performance in the last few weeks has been quite stagnant as it showed a negative 7.71% seven-day growth.
After touching the 0.3878 mark on 17 August, the token gained a southbound momentum and fell to $0.3447 on 20 August. At the time of writing, XRP was trading at $0.3451 with a market capitalization of $17,194,718,951.
However, Santiment pointed out an interesting fact. Despite the price plunge, XRP’s positive sentiment was well above several other better-performing cryptos, including Bitcoin [BTC] and Ethereum [ETH].
📊 Among top market cap assets in #crypto, those with the largest positive sentiment right now are #BinanceCoin, #Pancakeswap, #Theta, and #XRPNetwork.
Monitor where the euphoria and fear lies & get your Sanbase PRO trial to check in on models like these! https://t.co/MxzNQuX54O pic.twitter.com/sXkOS7jjeo
— Santiment (@santimentfeed) August 25, 2022
A quick look at the metrics
While Santiment’s data indicate better days for XRP in the near future, several on-chain metrics paint a different picture. For instance, the daily active address for XRP has been on a constant decline since the beginning of August.
Thus, indicating an outflow of investors from the network. XRP’s transaction volume also failed to show any significant spikes as it remained quite constant throughout August.
Moreover, Santiment’s chart showed that the development activity was also at significant lows after the price plunge on 18 August.
Well, all these metrics suggest that the coin might face difficulty in pushing its price upward in the short term.
Furthermore, the Market Value to Realized Value (MVRV), after falling to August’s lowest of 0.338, steadily moved upwards.
In fact, a look at XRP’s two-hour chart revealed a bullish ascending triangle pattern, further raising the chances of an uptrend.
The Exponential Moving Average (EMA) ribbons indicated a strong bear advantage in the market.
However, nothing can be said with utmost certainty as the Relative Strength Index (RSI) showed that the market was somewhat in a neutral position.
Furthermore, the Moving Average Convergence Divergence’s (MACD) data displayed the possibility of a bearish crossover soon, which might result in a further plunge.


