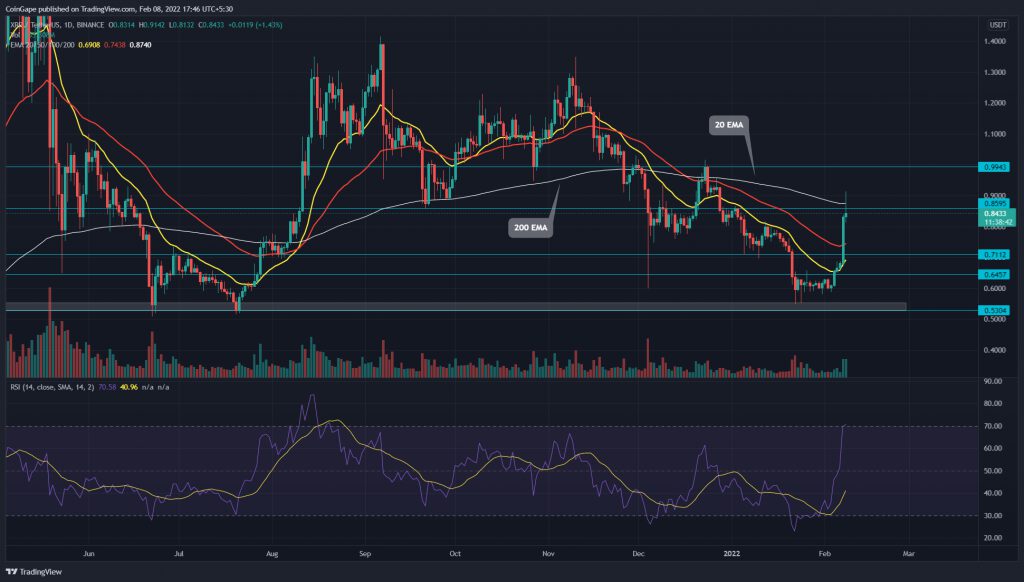
The XRP bulls provided an impressive 40% recovery in the last five days. However, the technical chart shows the February 7th daily candle provided the major contributions, with its 21% intraday gain. The sudden pump in XRP price could have been triggered by Ripple receiving permission from Judge Analisa Torres to respond to the SEC’s Memorandum of Law supporting its appeal of the fair notice defense.
Key technical points:
- The XRP buyers trying to reclaim the 200-day EMA
- The intraday trading volume in the XRP is $6 Billion, indicating a 105% gain.
Source- Tradingview
Escaping the two last week’s consolidations near the $0.6 mark, the XRP buyers rallied to the $0.86 mark. The coin chart showed five consecutive green candles, which drove the price through two significant resistance of $0.64 and $0.71.
The XRP/USD pair stands at a crucial level facing the shared resistance of $0.86 and 200-day EMA. The higher price rejection at this resistance indicates the sellers are defending this mark. If they succeed, the bears will pull the price back to the $0.71 mark.
However, the 20 and 50-day EMA curving indicates the buyers are strengthening their grip. Moreover, these EMAs could provide dip support if the price is just rejected for a minor pullback.
The Relative strength index(71) slope enters the positive territory in an upright movement. This sudden pump in RSI indicates heavy buying from investors.
The XRP Price Retest The $0.86 Mark

Source- Tradingview
The Ripple price provided a breakout and closed above the $0.86 resistance in the 4-hour time frame chart. The coin price is currently in a retest phase, trying to confirm sufficient demand. If buyers could sustain this level, the altcoin has a better possibility to initiate a bullish rally and hit its first target of $1.
The average directional movement index(55) slope marching north accentuates the rising bullish momentum.
Resistance levels- $0.86 and $1
Support levels- $0.71 and $0.65


