Disclaimer: The findings of the following analysis are the sole opinions of the writer and should not be considered investment advice.
- XRP is in a strong uptrend as the rest of the market fights the bears
- Watch out for the price reaction at these long-term resistance levels
XRP has posted remarkable gains in recent weeks, considering it was a top-10 crypto asset by market capitalization. The near 65% gains it has managed so far from the September lows came at a time when Bitcoin [BTC] did not have a strong trend behind it.
Here’s AMBCrypto’s Price Prediction for XRP in 2022
New addresses on the network soared recently and added belief to the idea of heavy demand behind XRP. At a time when many assets on the market lacked an uptrend or were within a longer-term downtrend, XRP has been one of the larger outliers. Was this too good to be true, or will XRP be able to surge past the resistance overhead?
Fibonacci extension level sets up an ambitious target for bulls
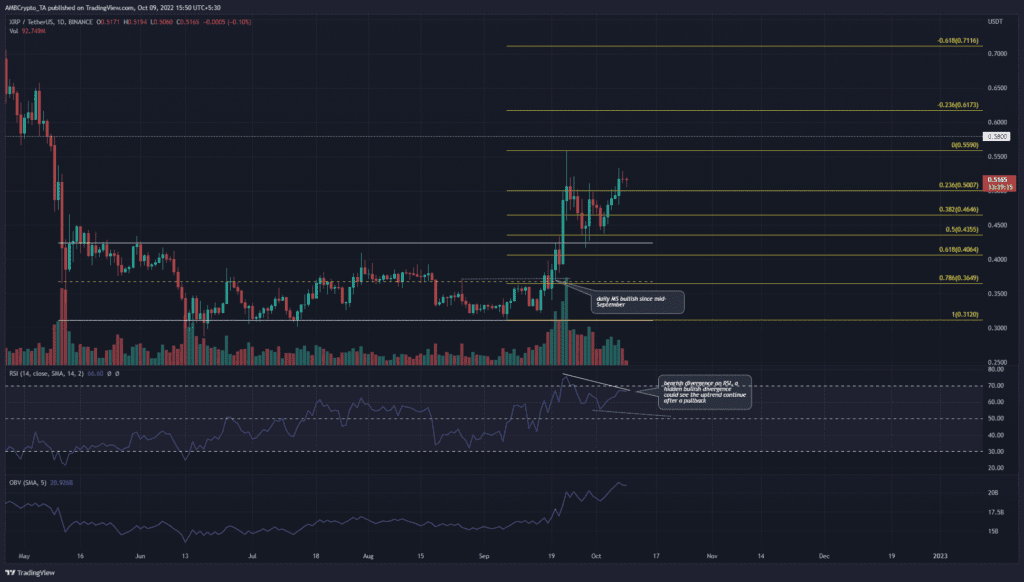
In September, the price broke out of a nearly four-month range that extended from $0.31 to $0.42. Toward the end of September, the $0.42 level was retested as support, and XRP saw a strong bounce to reach $0.5.
This showed that the former range highs were flipped to support. The On-Balance Volume (OBV) has also seen remarkable gains in recent weeks, highlighting heavy buying pressure behind XRP.
The Fibonacci extension levels (yellow) presented a bullish target of $0.61 and $0.71 for XRP. If XRP could climb above $0.56, there was a good chance that the rally could continue. This could see the price rise as high as $0.71.
The Relative Strength Index (RSI) formed a bearish divergence, and this could be followed a pullback. The $0.5 and $0.465 retracement levels can be used to buy XRP. A session close below $0.435 would flip the structure to bearish.
The aforementioned bearish divergence could be followed by a hidden bullish divergence. Traders can use such a development, alongside a retest of the aforementioned support levels, to look for opportunities to long the asset.
Has MVRV found a long-term bottom in June?

Source: Santiment
In late June, the MVRV Ratio (365d) fell to the lowest level in nearly 18 months. Since then, the ratio slowly began to rise higher even though XRP itself was stuck in a range. Santiment data showed that going as far back as 2015, these same lows have not been breached on the MVRV. Yet, we can not conclude that XRP has formed a long-term bottom in recent months.
The funding rate ticked into positive territory in October as the futures market flipped from bearish to bullishly biased.
The breakout from the range highs at $0.42 had strong demand behind it. The rally could continue higher to reach $0.58 and $0.71. The $0.7-$0.76 was a strong zone of resistance where a rally could fizzle out. Risk-averse traders can look for a retest of the $0.48-$0.44 area to load their bags.


