XRP (XRP) is showing bullish signs above a crucial horizontal support area and could soon initiate an upward movement towards the closest resistance.
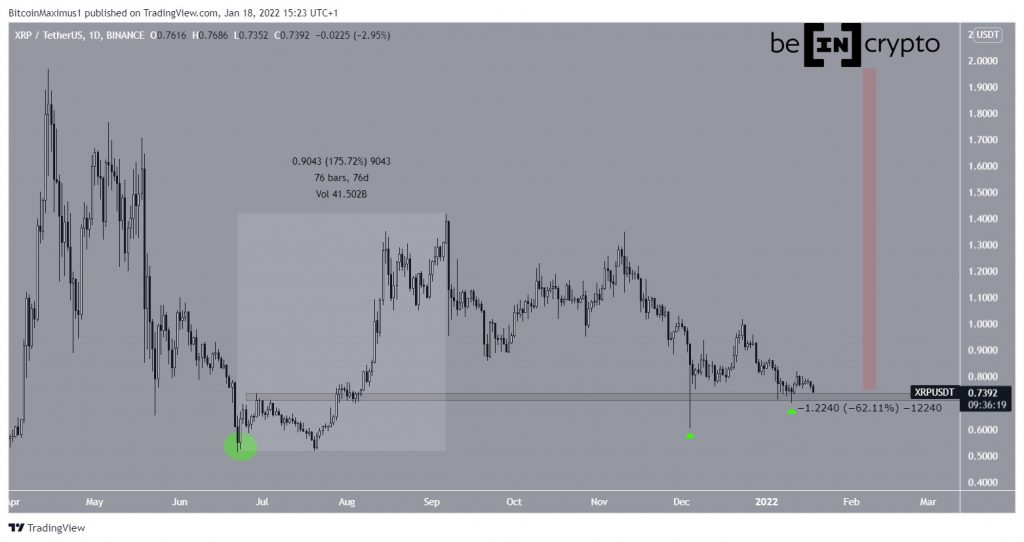
XRP has been moving downwards since reaching a high of $1.96 on April 14. So far, it has decreased by 62%.
However, it is possible that the token reversed its bearish trend after reaching a low of $0.50 on June 22 (green circle). The ensuing bounce led to an upward movement that continued for 76 days and had a magnitude of 176%.
While XRP has been falling since, it bounced at the $0.72 horizontal area twice (green icons), creating long lower wicks each time.
Therefore, as long as the token is trading above this level, the possibility that the structure is still bullish remains intact.
Future movement
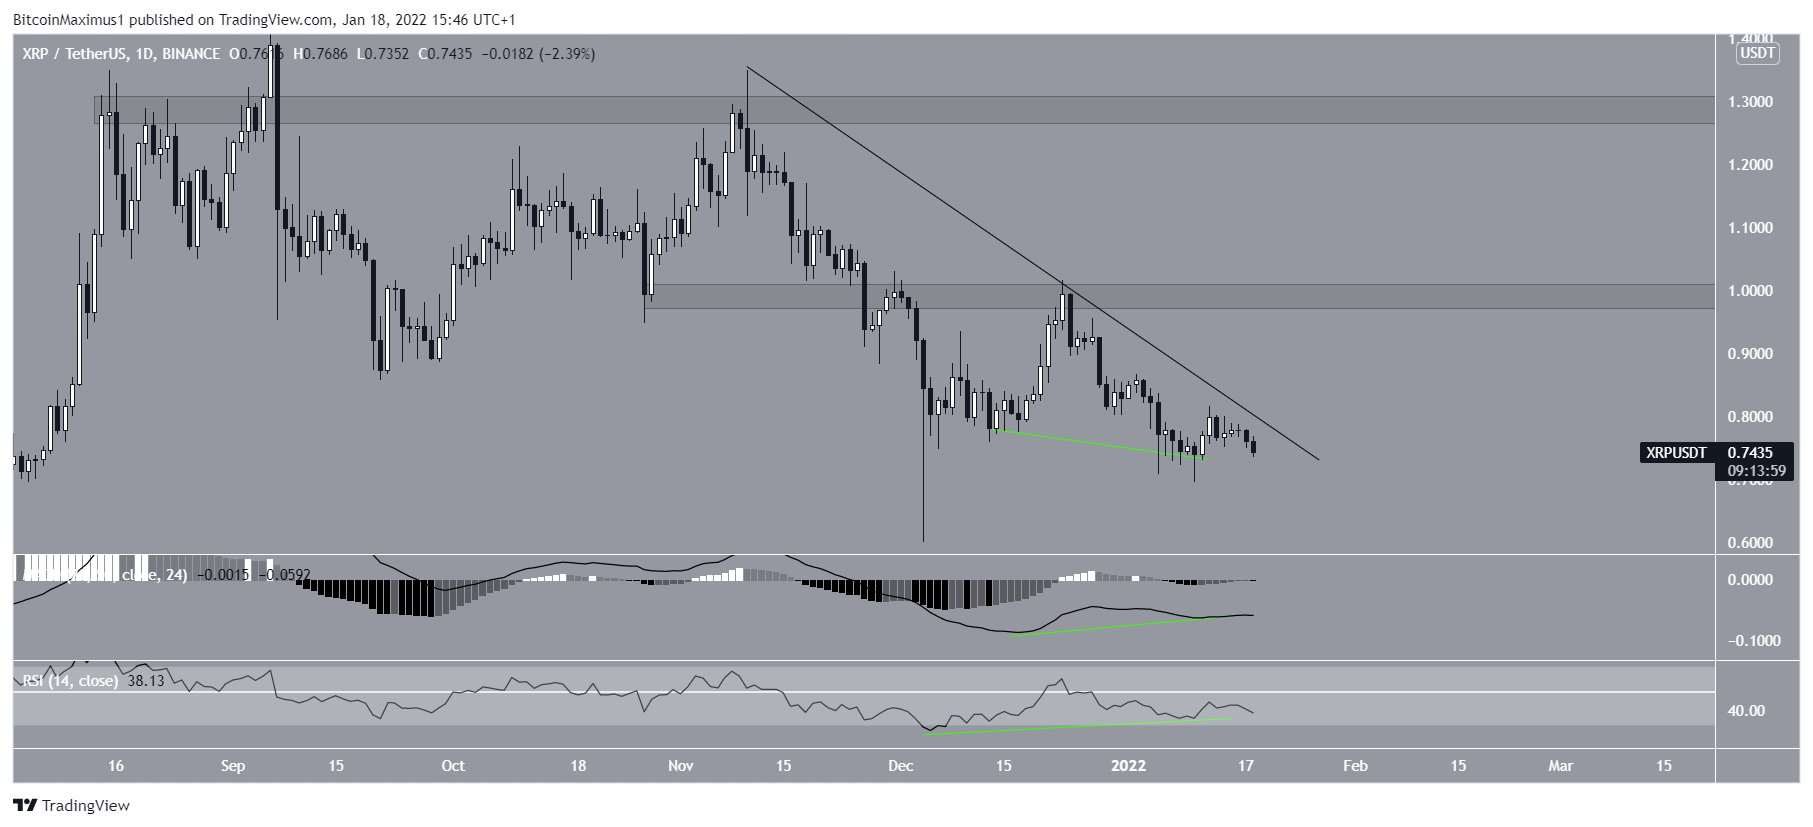
A look at technical indicators in the daily time-frame provides a bullish outlook. This is especially visible by the considerable bullish divergence that has developed in both the RSI and MACD (green lines). This is a bullish sign that very often precedes significant upward movements.
Currently, XRP is following a descending resistance line. If the divergences play out and the token breaks out from this line, the closest resistance levels would be at $1 and $1.30, respectively. These are both horizontal resistance levels.

XRP/BTC
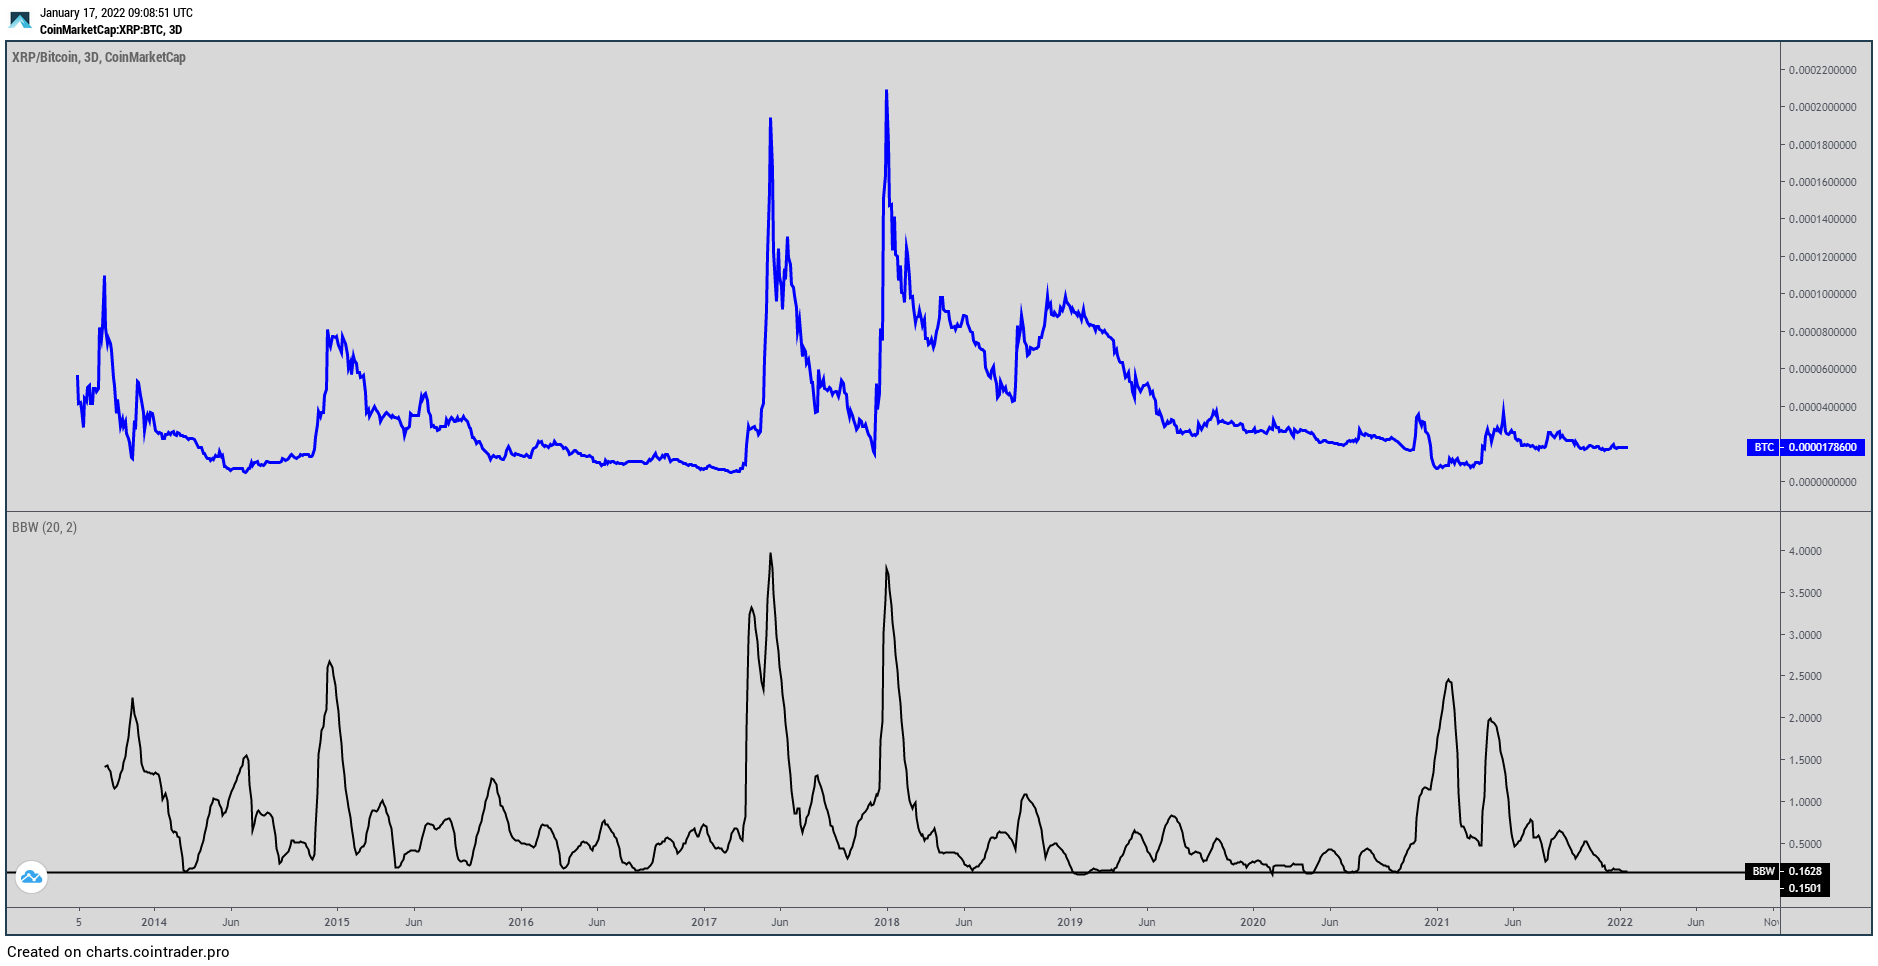
Trader @BTC_y_tho tweeted a XRP/BTC Chart, stating that the token is approaching an all-time low in volatility.

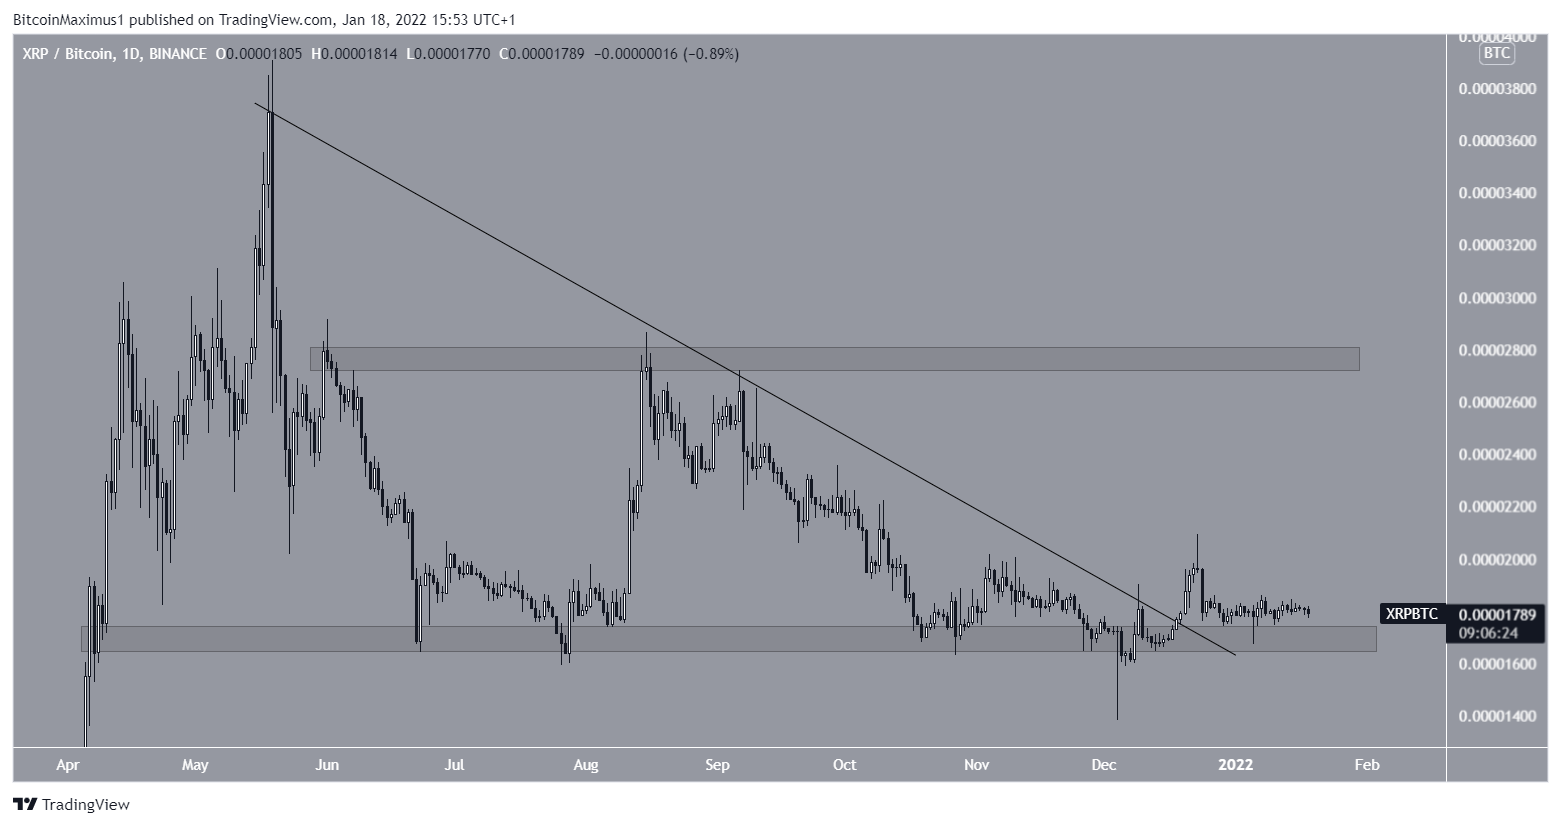
The XRP/BTC chart shows that the token has already broken out from a descending resistance line. Despite the lack of an upward movement, it has been steadily consolidating above the 1700 satoshi support area, hence the decrease in volatility.
If an upward movement transpires, the closest resistance area would be at 2800 satoshis.

BeInCrypto’s latest Bitcoin (BTC) analysis, click here.
Disclaimer
All the information contained on our website is published in good faith and for general information purposes only. Any action the reader takes upon the information found on our website is strictly at their own risk.


