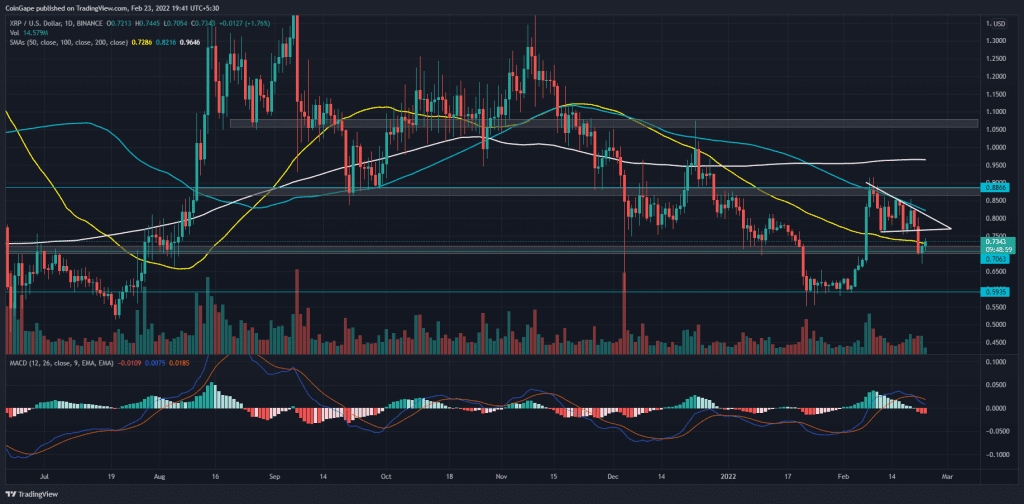
The XRP price gives a bearish breakout of the pennant formed in the daily chart resulting in a downfall of 18%. The free fall takes a dip to $0.70 before showing a bullish recovery of 10% in the past 48 hours. Will this recovery set a new bullish path or a post-retest reversal is inevitable?
- The daily MACD and signal lines give a bearish crossover
- The XRP price breaks the range formation within the 100 and 50-day SMA
- The 24-hour trading volume in the Ripple token is $2.86 Billion, indicating a 33.78% loss.
Source-Tradingview
The XRP price formed a pennant with the 50% rally ranging from $0.58 to $0.89, which later got sucked into a triangle pattern. However, the sudden surge in the selling pressure on 21st February broke the support trendline.
The free fall resulted in the altcoin price testing the $0.70 horizontal level with the lower price rejection avoiding a closing below it. Coming to the bullish reversal observed over the last 48 hours, the recovery comes as a retest of the bearish breakout which has high chances of going down the bearish road.
The downsloping crucial SMAs(20, 50, 100) indicate a bearish tendency. Moreover, the 100-EMA provides a dynamic resistance to XRP buyers,
The XRP Rally Ready To Retest The Fallout

Source- Tradingview
The sudden reversal in the altcoin price prints a short-term bullish rally on the XRP/USD chart. The rally is on the verge of retesting the support trendline that shows high reversal potential. The reversal may break below $0.70 and reach the $0.59 mark.
The daily MACD and Signal lines project a bearish crossover, with the bearish histograms gradually gaining momentum.
Alternately, If XRP prices sustain above the $0.77 mark or the support trendline, we can see the buyers entering to accelerate the prices to the $0.88 mark.


