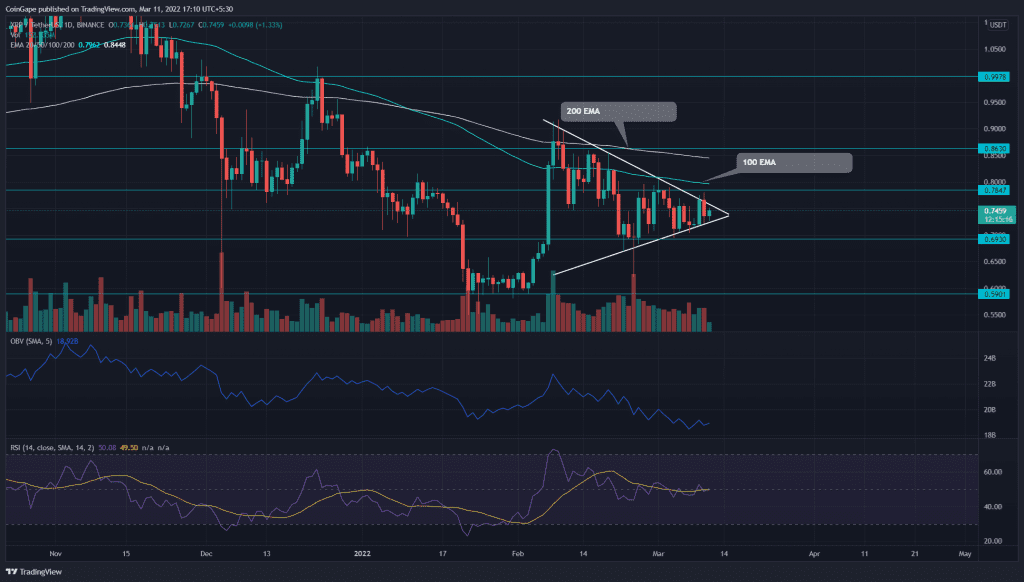
Uncertainty among the market traders has cramped the Ripple(XRP) price inside a symmetrical triangle pattern. However, as the days pass, the price range gets narrower, suggesting the altcoin is poised to breakout. On Friday, the technical chart forms a Daily-Doji candle with 0.50% intraday gain.
Key points
- The XRP bears maintain a bearish alignment among the EMA lines(20, 50, 100, and 200)
- The Tug-of-war inside the triangle pattern will soon come to an end.
- The intraday trading volume in the XRP is $2.4 Billion, indicating a 2.48% loss.
Source- Tradingview
On March 9th, the XRP buyers attempted to breach the overhead trendline of the symmetrical triangle pattern. However, the traders continued to sell at this dynamic resistance and pulled the altcoin inside the price pattern. For almost three weeks, the XRP/USD price resonates between the $0.785 and $0.6 levels
As the XRP community believes the defendants will win in the Ripple Vs SEC lawsuit, the buyers would try to end this sluggish rally with a decisive bullish breakout. If they succeed in sustaining the altcoin above the descending trendline, the bulls will drive the price $0.9 mark.
Conversely, if sellers breach the bottom support trendline, the traders can expect a 15% freefall, retesting the January low support($0.586).
Technical Indicator
The OBV indicators show a steady decline in volume activity since the beginning of the correction phase.
The Ripple(XRP) price trading below the crucial EMAs(20, 50, 100, and 200) suggests the bears have the upper hand. Moreover, the flattish nature of these EMA lines highlights a sideways rally.
Since Mid-February, the Relative Strength Index(49) slope has been wavering around the midline, indicating a neutral tendency.
- Resistance level: $0.85 and $1
- Support levels: $0.745 and $0.59


