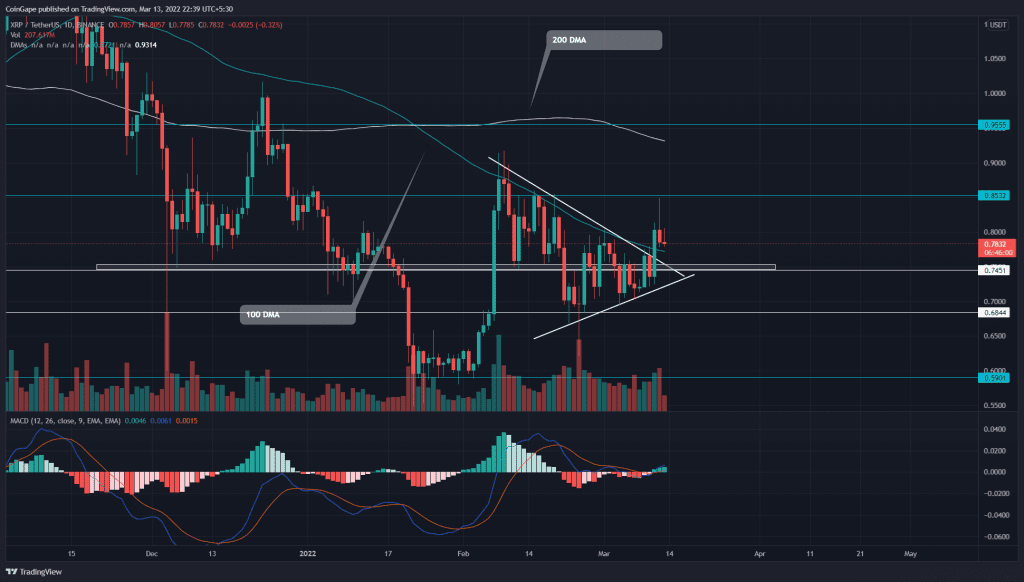
On March 11th, the Ripple(XRP) price finally escaped from the sluggish down rally governed by the descending trendline. The sudden price jump was backed by the recent news of the XRP vs SEC lawsuit in which the judge denied the SEC’s attempt to prevent Ripple from pursuing its fair notice defense. This small win encouraged the investors to breach the symmetrical triangle pattern.
Key points:
- The XRP price faces strong rejection from the $0.85 resistance
- The XRP buyer plans to turn 100 DMA into a valid support
- The intraday trading volume in the XRP is $2.07 Billion, indicating a 57.6% loss.
Source- Tradingview
The Ripple(XRP) price recently broke above the symmetrical triangle pattern with an overnight growth of 8.5%. However, the breakout rally suddenly faced higher price rejection near $0.85, bringing a sharp retest to the broken trendline.
The high selling pressure hints at the altcoin succumbing back under the triangle pattern. However, if the retest succeeds, a bullish reversal could surpass the $0.85 mark.
The post-retest rally could hit the 200-day EMA or even the $1 mark, depending upon the bullish commitment.
Contrary to the bullish thesis, if sellers pull the altcoin below the descending trendline, it would indicate the current breakout was a bear trap and will intensify the selling pressure.
Technical Indicator
The bullish breakout from the continuation pattern also breached the 20 and 100 DMA. As the altcoin retrace back to retest the breached resistance, the 100 DMA should bolster the buyers to continue the bullish rally.
The Moving average convergence divergence indicator lines enter the positive zone following a bullish crossover.
- Resistance level: $0.853 and $1
- Support levels: $0.745 and $0.68


