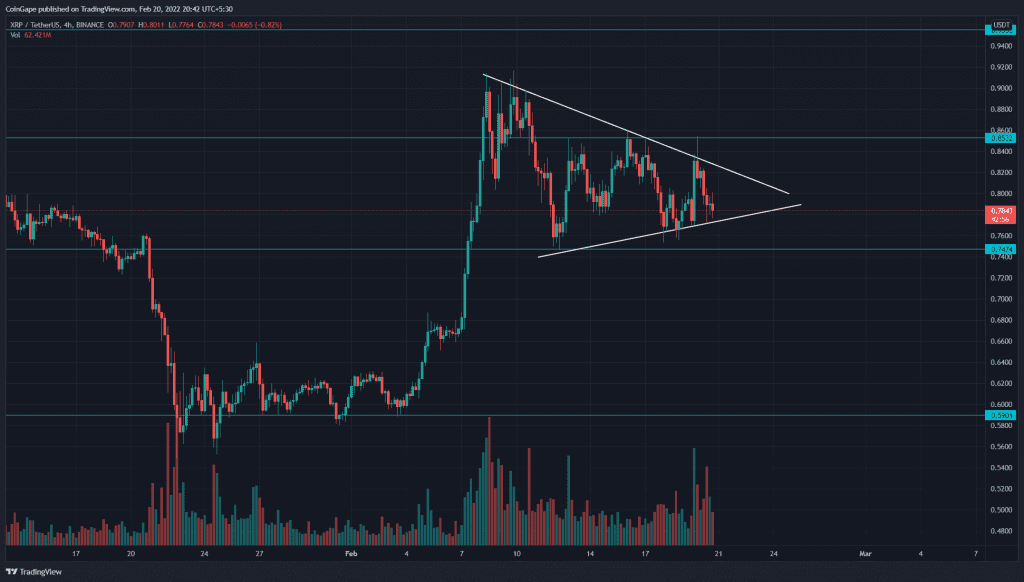
The parabolic recovery surged the XRP price to the $0.91 mark. The one-week rally registered a 50% recovery, allowing XRP buyers to fight for the $1 mark. However, the sellers defended the higher resistance and turned down the coin to $0.745. The altcoin currently wavers in a tight range should preparing for the upcoming move
Key technical points:
- The daily-RSI slope could slip below the neutral line.
- The 50-and-100-day sandwich the XRP price
- The intraday trading volume in the XRP is $3.12 Billion, indicating a22.08% hike.
Source- Tradingview
The XRP price has been resonating between $0.853 and $743 for almost two weeks. However, the technical chart displays a flag pattern that states a higher possibility for bullish continuation.
Therefore, if buyers breach the overhead resistance, the altcoin would drive to the $1 mark, which is the key level for initiating a bullish rally.
The XRP chart shows 50 and 100 DMA act as dynamic support and resistance, respectively. A breakout from either of these DMA would provide an extra edge to the following rally.
Concerning the minor consolation in price action, the Relative Strength Index(52) travels a down rally, indicating the buyers are losing their grip. A breakout from the middle would offer additional confirmation for short-sellers.
Retest To Ascending Trendline Suggests A 22% Potential Decline

Source- Tradingview
As mentioned in our previous article, the XRP price had breached a highly influential support trendline on January 5th, and the recent recovery was a retest phase. Therefore contrary to the above-mentioned bullish pattern, the XRP/USD pair also poses a downside risk.
If sellers slump the coin price below the $0.745 support, the traders can expect a 22% fall to the $0.59
- Resistance level: $0.85 and $1
- Support levels: $0.745 and $0.59


