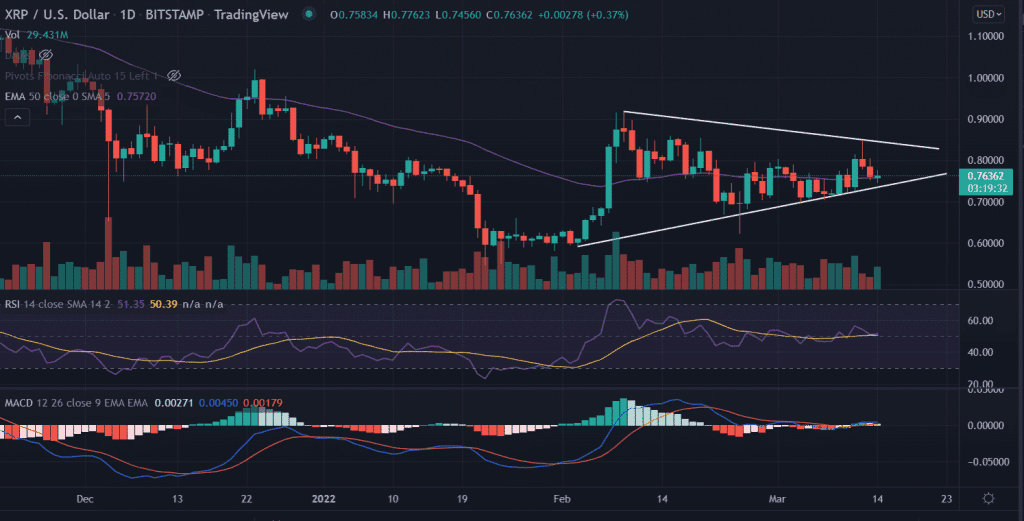
XRP price treads water on Monday as continued to trade lower for more than a month. XRP downtrend could see a bounce back as the price hovers near the critical support zone. Technical indicators remain neutral suggesting the price might consolidate further.
- XRP price trades with minute gains as manages to pause further declines
- Expect a bullish breakout as the price hovers inside a ‘Symmetrical’ triangle pattern.
- XRP is set for a bullish impulse near the critical support level.
XRP price looks for an upside reversal
XRP price appears to have reached another support area as it moves inside the “Symmetrical” triangle formation. The Symmetrical triangle formation is formed when the price makes higher lows and lower highs, where the price ultimate converges at the inflection point. Next, a breakout either upside or downside happens depending on other market conditions.
Currently, the XRP price rested at the ascending trendline of the channel that also coincides with the crucial 50-day EMA (Exponential Moving Average) at $0.75. However, an above-average volume indicates strength in the current price trend.
A resurgence in buying pressure will test the upper trendline of the triangle at $0.83. An extended positive momentum might bring $0.90 in play.
Alternatively, a lower breakout from the current price level will negate the bullish outlook for the token. In the case of downside momentum, the first target could be found at the $0.70 horizontal resistance level.
A spike in sell orders could trigger another round of selling while aiming for the lows of February 24 at $0.62.
Technical indicators:
RSI: The daily Relative Strength Index continues to coil near the average line with no clear directional bias. Any uptick in the indictor could strengthen the upside outlook.
MACD: The Moving Average Convergence Divergence loiters near the midline with mild positive bias.
As of publication time, XRP/USD is trading at $0.76, up 0.37% for the day.


