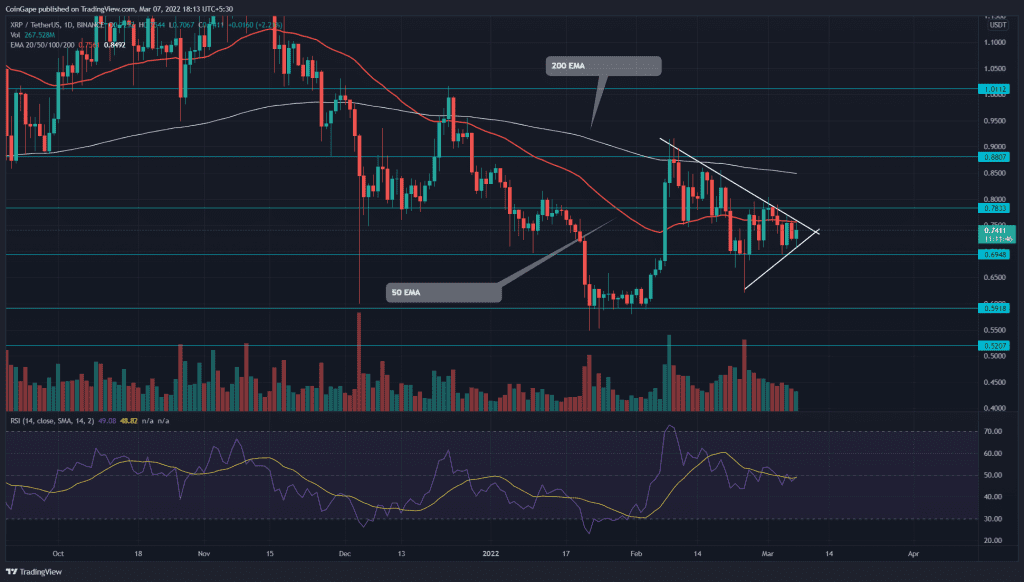
The Ripple (XRP) price resonating in a symmetrical triangle implies a range-bound rally in its technical chart. This minor range between the $0.78 and $0.65 suggests a no-trading zone for new traders. Can bulls break the ongoing correction chain, or will sellers continue to dominate?
Key points:
- Descending trendline restrict the buyers attempt to minimal
- The intraday trading volume in the XRP is $2.4 Billion, indicating a 1.8% hike.
Source-Tradingview
The Ripple(XRP) price has shown a slow and steady correction after being rejected from the $0.918 on February 9th. The sellers used a highly influential descending trendline to control the bullish rally, recording an 18% decline from the previous swing high(0.918).
However, the last two swing lows at $0.62 and $0.69 revealed the formation of a symmetrical triangle pattern. The coin price has been wobbling in a definite range of $0.78 and $0.65 for over two weeks now, approaching the pattern’s apex.
A breakout from either side of these converging trend lines would provide a strong direction for traders. If buyers manage to breach the overhead shared resistance of descending trendline and 50-day EMA, the altcoin would surge 16.8%n high, hitting the 0.9 mark.
Alternatively, if sellers pull the XRP price below the support trendline, the ongoing selling would intensify and dump the altcoin to the $0.59 monthly support.
Anyhow, the traders should wait until the price gives a breakout and closing beyond the trendline before they enter a new position.
Technical Indicator
The XRP price trading below the crucial EMAs(20, 50, 100, and 200) in a bearish sequence indicates the sellers have the upper hand, and the traders would find the path to least resistance downward.
The Relative Strength Index(49) slope constantly wavering around the neutral line accentuates a sideways rally.
- Resistance level: $0.85 and $1
- Support levels: $0.745 and $0.59


