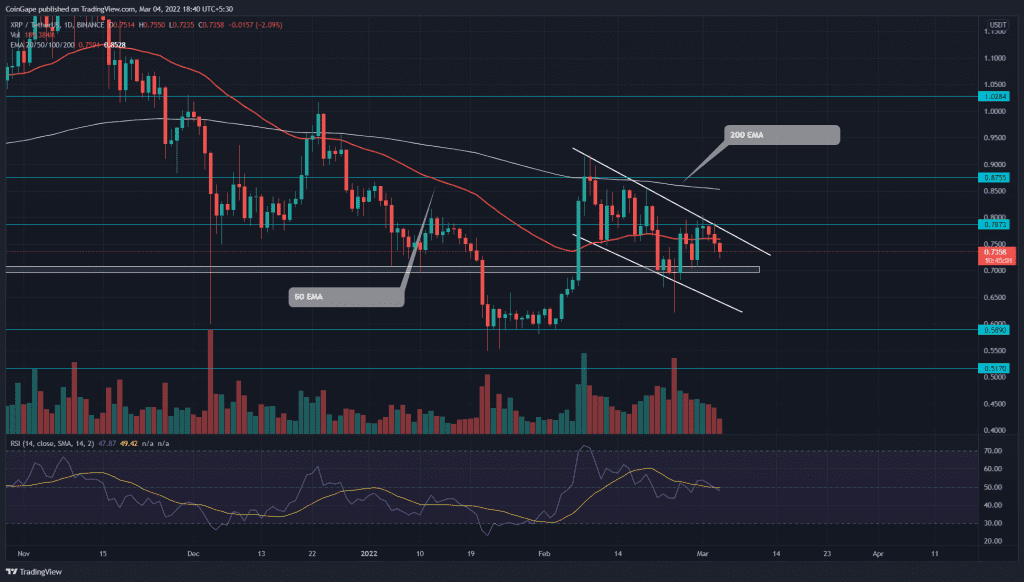
The Ripple (XRP) price trapped in the daily flag pattern has experienced its third reversal from the descending trendline. Following an evening star candle, the altcoin continued to march lower today, indicating a 1.78% intraday loss. The sellers could pull the coin to the base support trendline before the buyers could initiate the next bull cycle.
Key technical points
- The daily-RSI slope nosedived into the bearish region
- The Flag pattern governs the ongoing correction
- The intraday trading volume in the XRP is $2.32 Billion, indicating a 2.9% hike.
Source: Tradingview
On February 11th, the XRP/USD pair turned down from the shared resistance of $0.7 and 200-day EMA, indicating the sellers are aggressively defending the level. The correction rally revealed a flag pattern in the daily time frame chart, registering a 25% loss from the February high($0.91).
Recently, the XRP price has faced its third rejection from the descending trendline($0.8), forming three straight daily red candles.
Following the price pattern, the sellers would sink the altcoin by another 15%, bringing it to the bottom support trendline. However, the bears could struggle at in-between support at $0.7.
Moreover, the flag pattern is a bullish continuation pattern and breakout, and closing above the resistance trendline would provide the first sign of XRP recovery.
Technical Indicator
The recent price correction has slipped the XRP price below the crucial EMAs(20, 50, 100, and 200), suggesting the path of least resistance is downward.
The Relative Strength Index(49) slope plugged below the midline and 14-SMA, indicating the negative sentiment has revived.
- Resistance level: $0.78 and $87
- Support levels: $0.7 and $0.5


