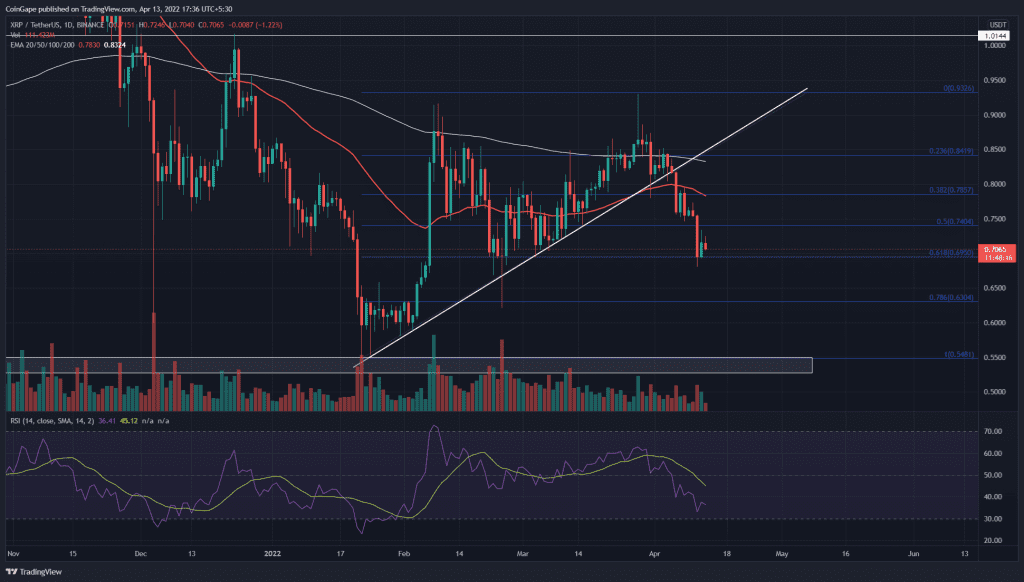
On March 28th, the Ripple(XRP) price turned down from the $0.93 high and breached a dynamic support trendline on April 5th. The sustained selling tumbled the altcoin by 15% and plummeted to the $0.618 FIB level. Today, the XRP/USDT pair price is down by 1.3% and may tease a fallout from the bottom support.
Key points:
- The daily-RSI slope is nearing the oversold region
- The intraday trading volume in the XRP is $1.82 Billion, indicating a 17.2% loss.
Source- Tradingview
Fighting-off high volatility in February and March, the XRP/USDT pair maintained a short-term bullish trend responding to an ascending trendline. However, for mere seconds, the recovery rally retested the February peak($0.918) on April 3rd and reverted with a long wick rejection candle.
The sellers continued to pressurize the XRP price and plunged it below the dynamic support trendline. As a result, the selling momentum accelerated and slumped the altcoin to a $0.618 Fibonacci retracement.
The 0.618 FIB level aligned with the $0.7 psychological support mounts a strong demand region for buyers. However, the chart hasn’t provided any significant sign for reversal which keeps the fallout possibility on the cards.
If sellers breach this support level, the crypto traders can expect a 9.58% fall to the $0.786 FIB level($0.632).
Technical Indicator
The longer EMAs(100 and 200) following a sideways path accentuate a range-bound rally for XRP. However, a bearish crossover between the 20 and 50-day EMA may encourage the $0.7 breakdown.
The RSI slope experienced a relatively severe fall which sank it to the 33% mark. The indicator value will soon reflect an oversold signal if the correction continues, undermining any further decline.
- Resistance level: $0.73 and $78
- Support levels: $0.7 and $0.63


