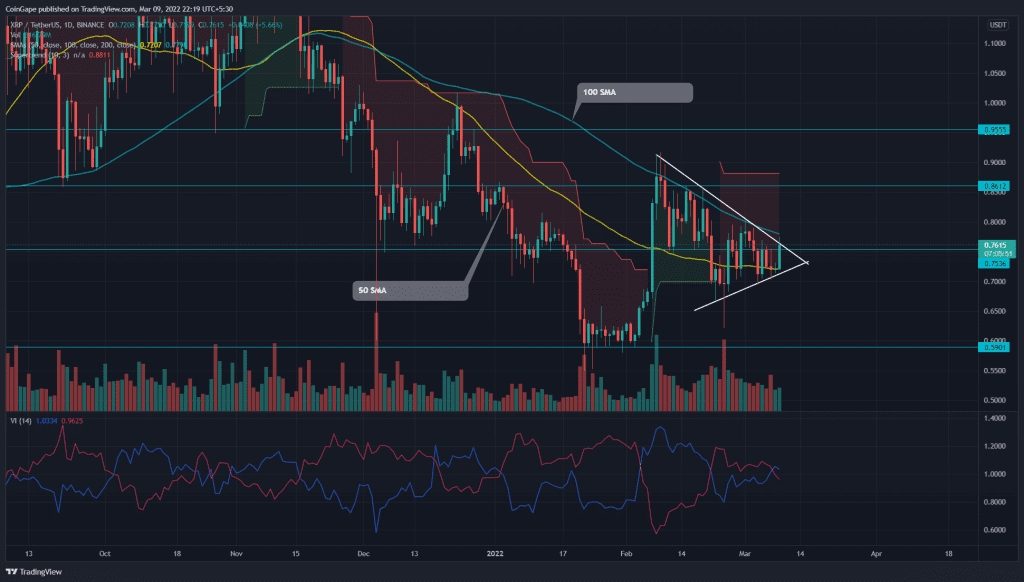
As the crypto market surges high on Wednesday, the Ripple (XRP) buyers plan to end this sluggish range-bound rally by giving an upside breakout from the symmetrical triangle pattern. The coin chart shows a long bullish engulfing of $6.8% intraday gain, piercing the dynamic resistance trendline.
Key points:
- The XRP buyers flipped the 50-day SMA into valid support.
- The Vi indicators provide a positive crossover among the VI+ and VI- line
- The intraday trading volume in the XRP is $2.4 Billion, indicating a 2.48% loss.
Source- Tradingview
The Ripple(XRP) price fluctuated within the symmetrical triangle pattern for almost a month. This continuation pattern provides a strong directional move to traders once the price breakout on either of the converging trendlines.
Today, the altcoin showed a strong rebound from the support trendline, bolstering the buyers to breach the overhead trendline. The renewed buying pressure could surge the coin price by 12.5%, hitting the $0.86 resistance and later $1.
On the contrary, if sellers pulled the XRP price below the breached resistance, the resulting fakeout would trap the aggressive buyers and slump the coin back to support the trendline.
Technical Indicator
The Ripple(XRP) price is sandwiched between the downsloping 50-and-100-day SMA, indicating a bearish bias. However, a bullish breakout of the dynamic resistance 100 SMA will provide an extra edge to long traders.
The Vortex indicator shows a bullish crossover between the VI+(blue) and VI-(pink) lines, indicating a buy signal. However, the negative curve in the blue line undermines positive crossover and limits the bullish spread.
The Super trend indicator share a bearish tendency in the daily time frame chart
- Resistance level: $0.85 and $1
- Support levels: $0.745 and $0.59


