While the top cryptos exhibited mixed trading signs, the overall market noted a marginal plunge over the past day. Besides, XRP hit its two-month high on 10 November, whereas Loopring touched its ATH on the same day.
Near-term technicals for both the alts favored a correction by hinting at decreasing buying power. On the other hand, Shiba Inu bulls showed revival signs post a 37.5% retracement since its ATH.
XRP
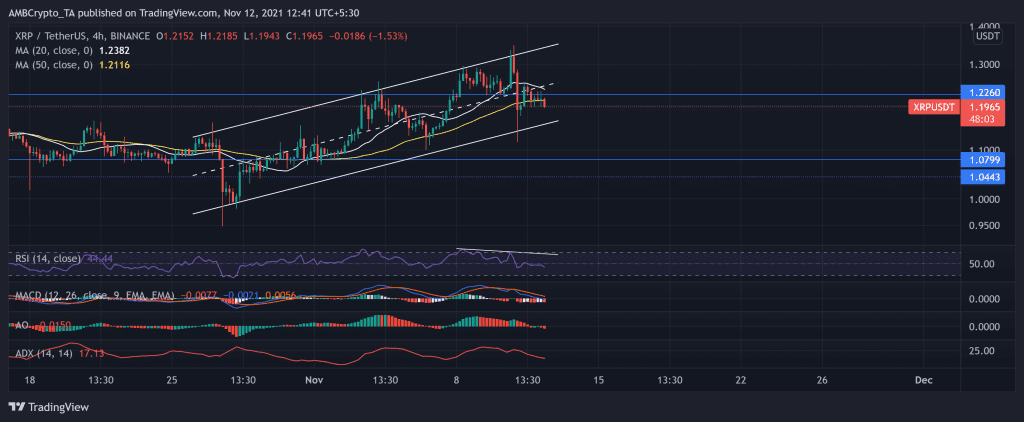
Over the past 15 days, XRP enjoyed a sustained rally after swinging in an ascending parallel channel. The seventh-largest crypto registered an approximately 14% ROI in the past two weeks. Moreover, XRP bulls refused to withdraw as the price action breached its immediate resistance. Consequently, the price hit its two-month high on 10 November.
However, as bears ensured resistance at the upper trendline, price retraced between the channels. This pullback dragged the prices below the 20-50 SMA, demonstrating a near-term bearish inclination. Now, as bulls again try to breach the $1.226-mark, the near-term technicals favored the sellers. At press time, XRP traded at $1.1965 after noting a nearly 2% loss in 24 hours.
The RSI was at the 44-mark and was descending. Further, the bearish divergence along the RSI and price action affirmed the selling vigor. Also, the MACD and AO readings agreed with the previous analysis. Nevertheless, the ADX displayed a weak directional trend.
Shiba Inu (SHIB)
The dog-themed token undertook an instantaneous uptrend from 23 October. The price action rallied by over 200% over the next five days to reach its ATH on 28 October. After which, the price retreated in a descending triangle below its immediate resistance as it saw a pullback.
Since its ATH, the crypto noted a 37.5% loss in the correction phase. However, the crypto was still green on its monthly charts and traded at $0.00005345 at press time.
Over the past day, near-term technicals pointed at a bullish revival from the bearish dominance over the week. The RSI witnessed a 17-point surge in the last two days from the oversold region. Also, the AO pointed at decreasing bearish momentum in the near term. Nonetheless, ADX displayed a substantially weak directional trend.
Loopring (LRC)
LRC witnessed an enormous price rally of over 800% from 28 October until 10 November. Post a bull-pennant breakout, LRC entered into price discovery and found its ATH at $3.85 on 10 November. As bears tried to counter the overall bullish vigor and influence, LRC saw a 13% decline over the past day.
The near-term technicals were in harmony with the recent counter of the bears. The RSI plunged by nearly 25 points in two days. Also, the AO and MACD flashed red signs and decreased buying momentum in the near term.


