After witnessing an upward movement over the previous week, XRP, Vechain, and Tezos struggled to maintain an uptrend. Furthermore, the buying strength of XRP and XTZ dropped by a significant margin. However, VET seemed consolidated on its chart.
XRP (XRP)
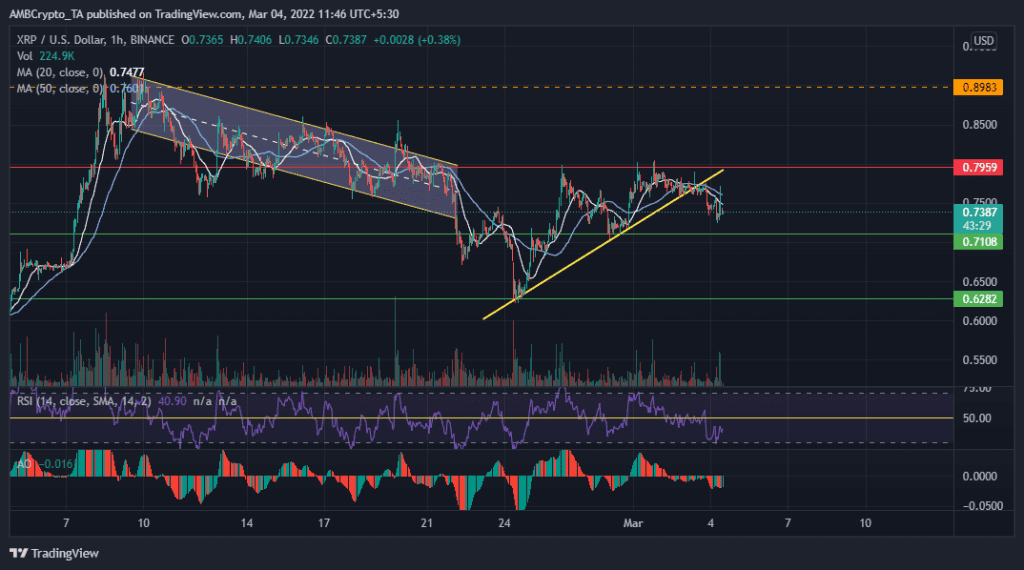
XRP witnessed a gradual descent from the $0.89 level in the first half of February. This pushed the alt to find critical support at the $0.62 level on 24 February. However, after 24 February, amidst escalating tensions in Ukraine, XRP still managed to bounce back and has maintained an upward trajectory since (yellow trendline).
After facing a major sell-off, XRP witnessed an increase in buying strength. At the current price, if bulls exert pressure, the token might test a local resistance at the $0.79 level. Since 25 February, XRP has traded between its previous level of support at $0.71 and the near-term resistance at the $0.79 level. The price, however, breached the trendline support (yellow) on 3 March for the lack of much demand. And, it might as well retest the support level at $0.71 once again. Notably, over the last three days, a continuous decline in volume and buying strength has been noticed. The RSI as a result was hovering near 41.52 while the AO confirmed a bearish momentum for the next few hours.
Vechain (VET)
VET experienced a sharp decline from 17 February to 24 February. It moved in a descending channel to find necessary support at the $0.04012 level. The alt consequently bounced from there to move up over the past week and reached the local resistance at the $0.0528 mark.
Since 1 March, there hasn’t been significant movement in VET’s price action. In fact, it has been moving sideways. Even though it made a gain of 16.5% over the previous week, the coin dropped almost 4.65% over the previous day. At the time of writing, it was changing hands at $0.0525.
Judging by the price movement, VET could head towards a near-term support level at $0.0485 if bears take command. Notably, the $0.0528 level has been retested multiple times. Consequently, it has been weakened. The RSI gave mixed signals as it rested at 45.96 level. Furthermore, the DMI lines witnessed a bearish crossover. Thus, revealing a weak directional trend.
Tezos (XTZ)
Similar to that of XRP and VET, Tezos (XTZ) projected growth patterns over the last week. On 24 February, the coin received support at the $2.64 level. Following that, it moved up again to reach a resistance of $3.61 on 1 March.
However, post 1 March, XTZ developed a bearish directional momentum. Even though the alt managed to gain almost 7.5% over the past week, it dropped 5.22% over the past twenty-four hours. During press time, the alt traded at $3.28. If selling pressure kicks in XTZ can go down further to find a floor at $3.09. The RSI at 37.06 reflected the diminishing buying strength. Even the CMF declined below the half-line, indicating a slight bearish edge.


