Disclaimer: The findings of the following analysis are the sole opinions of the writer and should not be considered investment advice.
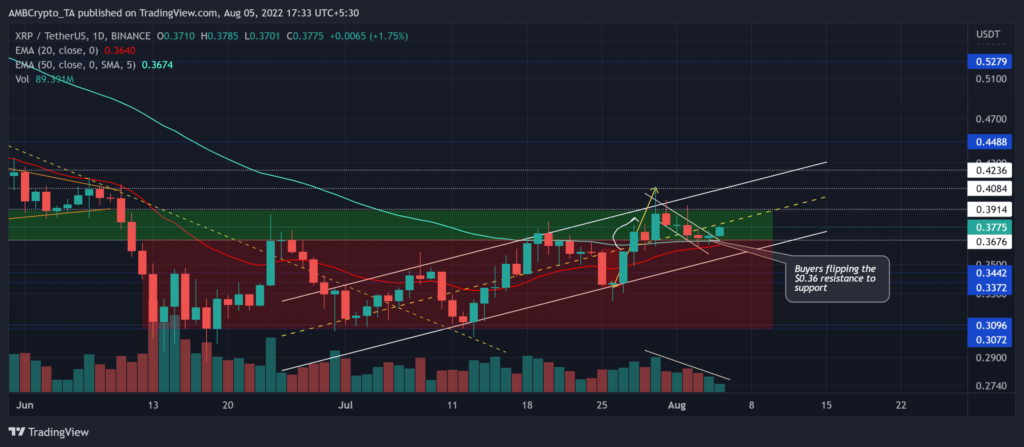
XRP observed a transient range-bound oscillation in the $0.307-$0.367 zone that lasted nearly seven weeks. However, the altcoin’s gradual increase in buying pressure led to a bullish flip of the $0.36 support. This growth entailed an ascending channel in the daily timeframe.
Meanwhile, buyers were yet to find a convincing close beyond the supply zone (green, rectangle) to establish a robust bullish narrative. A close above this level could aid the buyers in continuing their spree.
At press time, XRP was trading at $0.3775, up by 1.96% in the last 24 hours.
XRP Daily Chart
The alt tested the $0.307-$0.309 multi-year-long support range multiple times over the last month. But the buyers held their grounds to lay a foundation for impressive growth over a span of three weeks.
While the supply zone constricted the buying power, the altcoin marked a recovery above its 20 EMA (red) and the 50 EMA (cyan). The current up-channel trajectory has propelled a test of this supply zone many times. The bulls might exploit weaknesses in this zone, especially with a bullish flag setup finding support near its EMAs.
The rebound from the $0.36 support level has positioned XRP to test the $0.408-zone. A close beyond the supply zone could trigger a near-term buying edge. To top it up, bullish flag setups are generally more effective on a decreasing volume trend. In the case of XRP, the volumes were on a downtrend during the flag setup.
Rationale
The Relative Strength Index’s (RSI) comfortable position above the 54-support could play out in favor of the buyers in the coming sessions.
Also, the Chaikin Money Flow (CMF) marked lower peaks to depict a rather bullish divergence with price. Its immediate trendline support could reignite an uptick in buying volumes. Furthermore, the MACD lines maintained their bullish stance while swaying above the zero-mark.
Conclusion
Given XRP’s bullish flip on the $0.36 support alongside the bullish flag setup and the CMF divergence, the buyers would aim to continue the gradual growth on the charts.
An inability of the buyers to inflict a bullish crossover on the 20/50 EMA could extend the compression phase before a volatile break. In either case, the targets would remain the same as discussed.
Also, keeping an eye on Bitcoin’s movement and the broader sentiment would be important to determine the chances of a bullish invalidation.


