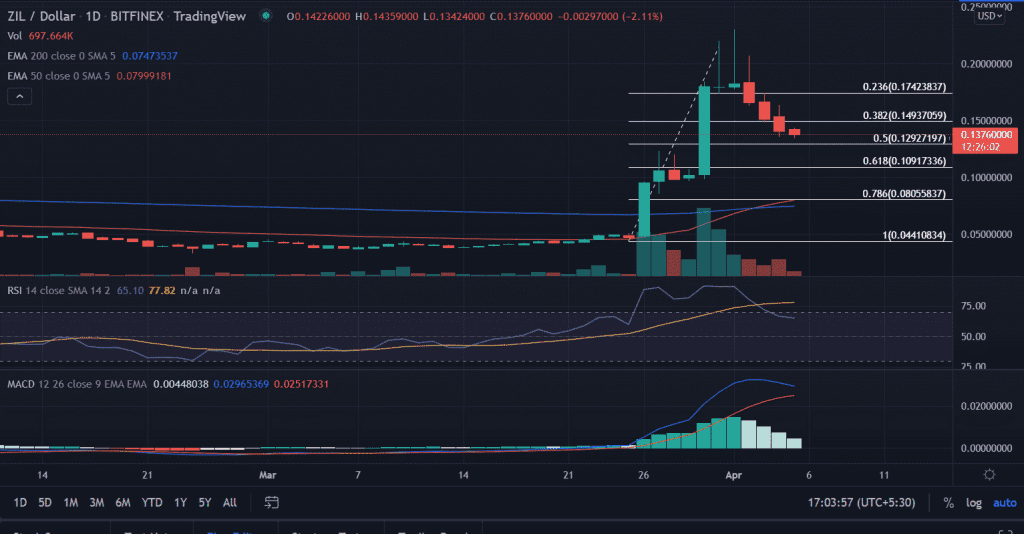
ZIL price falls for the fourth straight session in a row. However, the price traded in a very tight range indicating sellers might exhaust near the support level. ZIL opened lower and continued to trade in the negative territory.
- ZIL price trades with a negative bias on Tuesday.
- Expect more downside toward the 0.618% Fibonacci Retracement level.
- The momentum oscillators tilt in favor of the bearish sentiment.
ZIL price remains bearish
On the daily chart, the ZIL price trades in a downward channel after testing the record highs around $0.23 at the beginning of the April series. The price declined nearly in five days. Now, the price is taking support around 0.50% Fibonacci retracement level at $0.13.
Now, if the price breaks below the mentioned level then more downside can be seen in the token. In this scenario, the first lower target could be found at the 0.618% Fibonacci retracement, which is extending from the lows of $0.0, the level at $0.11.
An extended sell-off would bring the lows of March 30 at $0.09 into play.
On the contrary, if the price is able to sustain the session’s low then it could bounce back to the horizontal resistance level at $0.15. A resurgence in the buying momentum would pave the way toward the $0.23% Fibonacci retracement level at $0.18.
As of press time, ZIL/USD is trading at $0.13%, down 2.41% for the day. The 24-hour trading volume is holding at $1,684,627,128 as per the CoinMarketCap.
Technical indicators:
RSI: The daily Relative Strength Index slipped below the average line since April 2. The pair reads at 65.
MACD: The Moving Average Convergence Divergence indicates receding bullish momentum while it holds above the central line. Any downtick in the indicator could strengthen the bearish outlook on the price.


