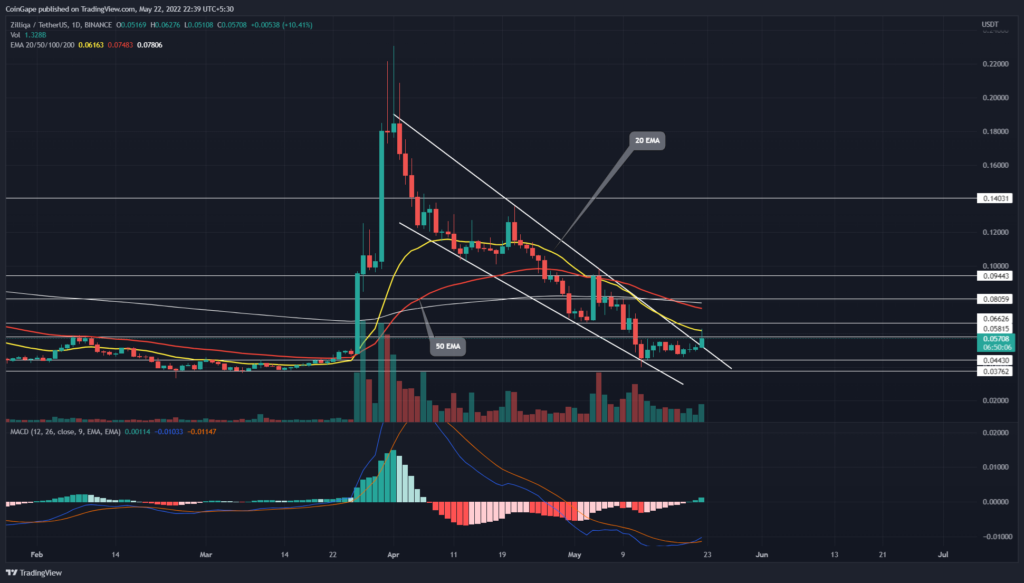
The falling channel pattern reflects an overall downtrend in Zilliqa(ZIL) price, which recently plunged to a low of $0.045. However, this altcoin escaped the uncertainty in the crypto market with a bullish breakout attempt from this channel pattern. A successful retest may provide a long opportunity to target the $0.1 mark.
Key points
- The ZIL price shows long wick rejection at 20-day EMA
- The ZIL buyers should wait for candle closing above the $0.058
- The intraday trading volume in the Zilliqa coin is $527 million, indicating a 128% gain.
Source- = Tradingview
The Zilliqa(ZIL) price has witnessed a gradual downfall since its last rally marked a high of $0.228. As a result, the downtrend evaporated nearly all the gains the coin holders experienced during the sudden boom in March.
The ZIL price has a recent market lower low of $0.04, registering an 82.6% fall from the mentioned high. Furthermore, the technical chart suggests this fall responding to the falling channel pattern.
On May 12th, the ZIL price rebounded from the support trendline and showcased a sideways rally to challenge the overhead resistance. Today, the altcoin displayed a significant inflow with a 20% intraday gain and teased a bullish breakout from the price pattern.
Trending Stories
A daily-candle closing above the descending trendline and $0.058 mark would trigger pattern completion and may drive the ZIL price back above $0.1.
advertisement
Technical indicator
The daily MACD indicator offers a bullish crossover in the negative zone, supporting the break strategy from the channel pattern.
The ZIL price undermined the recent death crossover of the 50-and-200-day EMA and rallied to the overhead trendline. Moreover, the 20-day EMA currently assists sellers in preventing a pattern breakout.
- Resistance levels- $0.058, and $0.066
- Support levels are $0.044 and $0.037a


