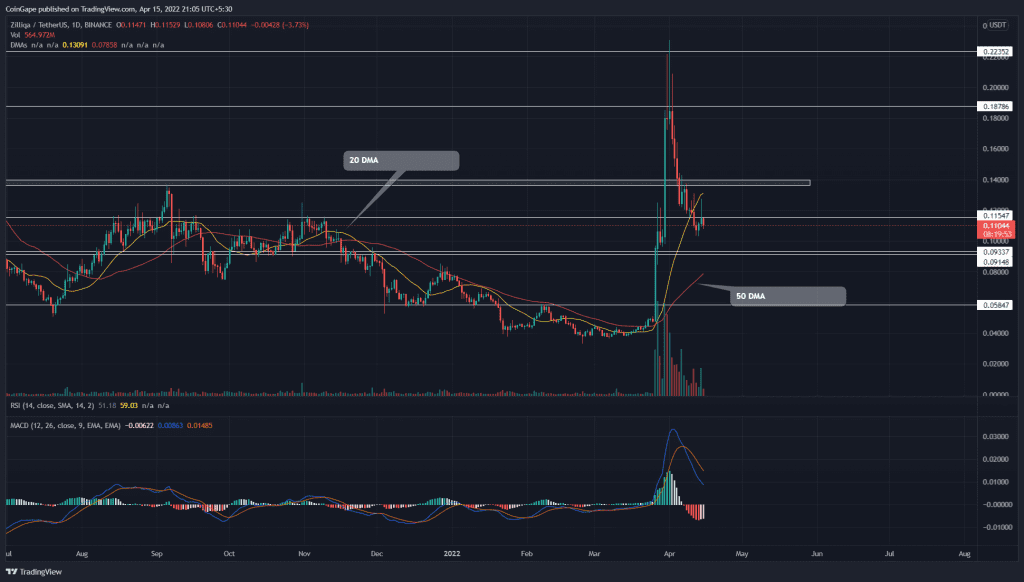
The Zilliqa(ZIL) correction rally has halved the coin value as it plunged below the $0.115 support. This breakdown suggests another leg down for ZIL price, targeting the $0.91 mark. However, can a golden crossover among the crucial DMA undermine the selling momentum?
Key points
- The ZIL chart reflects intense supply pressure at the $0.115 resistance
- The 50 and 200 DMA provides a golden crossover
- The intraday trading volume in the Zilliqa coin is $127.5 Billion, indicating a 138% gain.
Source-Tradingview
On April 1st, the ZIL/USDT pair hit the $0.232 mark, its highest level in the past eleven months. However, the higher-wick rejection candles at this level indicated the buyers were exhausted from the parabolic price recovery, which surged the ZIL price from $0.481 to $0.231 in just one week.
Furthermore, altcoin experienced a significant sell-off last week and slumped the price by 55% to the $0.103 mark. This correction rally last knocked out the $0.115 support level, and a successful retest to the new flipped resistance indicates the sellers are ready to extend this retracement.
Following a shooting star candle(long-wick), the ZIL price is down by 5.3% today and approaches the next supply zone at $0.915.
Trending Stories
Technical indicator
The ZIL buyers have lost 20 DMA support, which has now flipped to a viable resistance. However, a bullish crossover among the 50 and 200 DMA may interrupt a steady downfall.
Following a bearish crossover, the MACD and signal lines gradually lower to the neutral zone, indicating an aggressive selling in the market. However, these lines roaming in bullish territory project the overall tendency to be bullish.
- Resistance levels- $0.115, and $0.136
- Support levels are $0.0915 and $0.08


