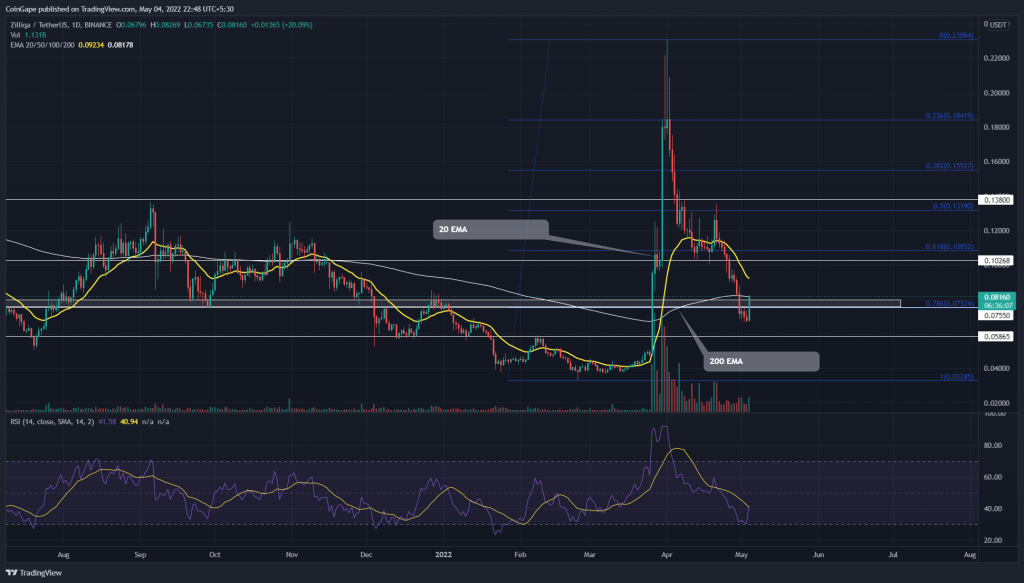
Zilliqa’s (ZIL) price witnessed a roller-coaster ride in the past two months, starting from a perpendicular rally near the March-end and then a striking dip in April. Furthermore, the ongoing correction has recently pierced the 0.786 Fibonacci retracement levels, but today’s sudden price jump marks it as a false breakdown.
Key points
- The $0.8-$0.75 support fakeout may surge ZIL price by 25%
- The ZIL price aims to reclaim 200-day EMA
- The intraday trading volume in the Zilliqa coin is $527 million, indicating a 128% gain.
Source- Tradingview
The ZIL price have been trapped in a bear market as the avalanche of falling prices started after the rejection faced at the $0.22 mark.
The deflation has brought the ZIL price below the $0.080 level during the end of April. However, early May is marked green as the bullish reversal retests the $0.08 fallout.
By the press time, the ZIL price traders at the $0.008 mark with an intraday loss of 18.6%.
Trending Stories
If the ZIL price provides bullish closing and sustainability above the $0.08 support zone and 200-day EMA, the traders can expect a potential bull run above the psychological mark of $0.1.
However, the resistance zone coincides with the 0.618 FIB level lowering the chances of a prolonged bull run.
Therefore, a much more likelihood of sellers regaining trend control to push below the $0.058 level to challenge the psychological support barrier of $0.050.
Technical indicator
RSI- The Relative Strength Index (37) slope shows a sharp surge from the oversold boundary, reflecting a bullish revolt ready to surpass the 14-day average.
EMA- The recent price jump attempts to retest the fallout of the 200-day EMA while the 20 and 50-day EMA give a bearish crossover, suggesting the sellers have the support hand
- Resistance levels- $0.1, and $0.12
- Support levels are $0.08-$0.075and $0.058


